

Our team is thrilled to announce Calculated Metrics, one of the most-requested features on our list!
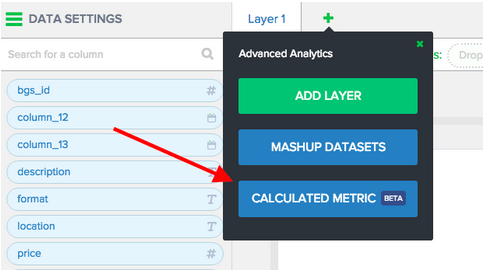
Our new Calculated Metrics feature allows you to create calculations based on individual numbers (layers) you create. To start, we are focusing the 4 basic formula operations of addition, subtraction, multiplication and division.
The most popular operator is division, in order to create ratio gauges. Ratio gauges provide a tremendous amount of insight and an added level of information because there is context to the metric. For example, we hinted at this release in a recent blog post about our new favorite gauge called the Kill Rate.
But here are a few more examples...
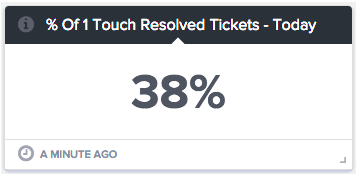
If your team closed 38 Tickets with 1 touch (meaning on the first interaction with the client) is that good or bad? That information is much more valuable when you compare it to the total number of tickets closed. For this example let’s assume it was 100 tickets closed for the day. With our calculated metrics you take the total Number of Tickets Resolved in First Touch (Layer 1) divided by Total Number of Tickets Resolved during the same time period (Layer 2) and get:
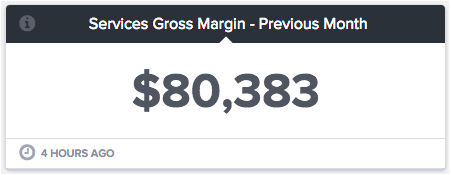
Another of our favorites from our QuickBooks integration is calculating your Service Gross Margin. In order to see your Service Gross Margin you need to pull your Total Services Revenue (layer 1) and subtract your Services Cost of Goods Sold (layer 2) which then leaves you with your Services Gross Margin:
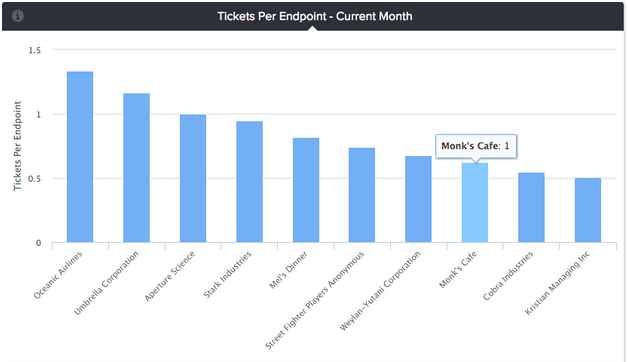
Tickets per Endpoint is a great indication of which customers make the most ‘noise’. The beauty of this metric is that it not only factors in the total number of tickets and endpoints but it also creates a ratio between the two which helps normalize the data. So you may have a client with 100 tickets per month but 1000 endpoints and then another client with 50 tickets per month but 50 endpoints. By looking at the ticket number you might think the lower volume is better but when compared to the endpoints it becomes obvious it’s not.
So what are you waiting for? Learn more about our Calculated Metrics plan here and let us know if you have questions!

Free MSA Template
Whether you’re planning your first managed services agreement, or you’re ready to overhaul your existing version, we've got you covered!

