
BACK


During phases of rapid growth, all too often, solid data practices fall by the waste side. However, it is during this time that data-driven process development becomes even more important. Being able to see and track your improvements over time will be paramount to your success. BrightGauge is the perfect companion along any growth journey as it enables you to track process changes and determine whether they were successful or need further revision. Over time, this can lead to a fine tuned system for service delivery excellence.
For the June Dashboard of the month, we have featured a Service Delivery Management dashboard inspired by June's user showcase webinar, Continuous Revision as a Recipe for Operational Excellence with Jeremiah Best, the VP of Service Delivery at Aligned Technology Solutions.
Aligned Technology Solutions operates nationally, offering managed IT, cybersecurity, compliance & vCIO, cloud solutions, and CMMC certification. They cater to a wide range of industries with a focus on government contractors, nonprofits & associations, health care, and professional services. They have successfully operated in an ever-evolving space because of their adaptability and ability to build strong personal relationships with dedicated experts. These personality traits are reflected back in their approach to data visualization and goal management as showcased through BrightGauge.
The Service Delivery Management dashboard features the key metrics shared by Jeremiah Best, used at various stages of their growth. Jeremiah, having 16 years experience across various service delivery roles in the MSP space, shared the importance of having a continuous improvement mindset in order to grow. Over his tenure and with the guidance of consultative coaching by Seal-Level Operations and their IT Nation Evolve peer group, Jeremiah has built and rebuilt their dashboards and goal lists several times to aid in refining their processes to maturity.
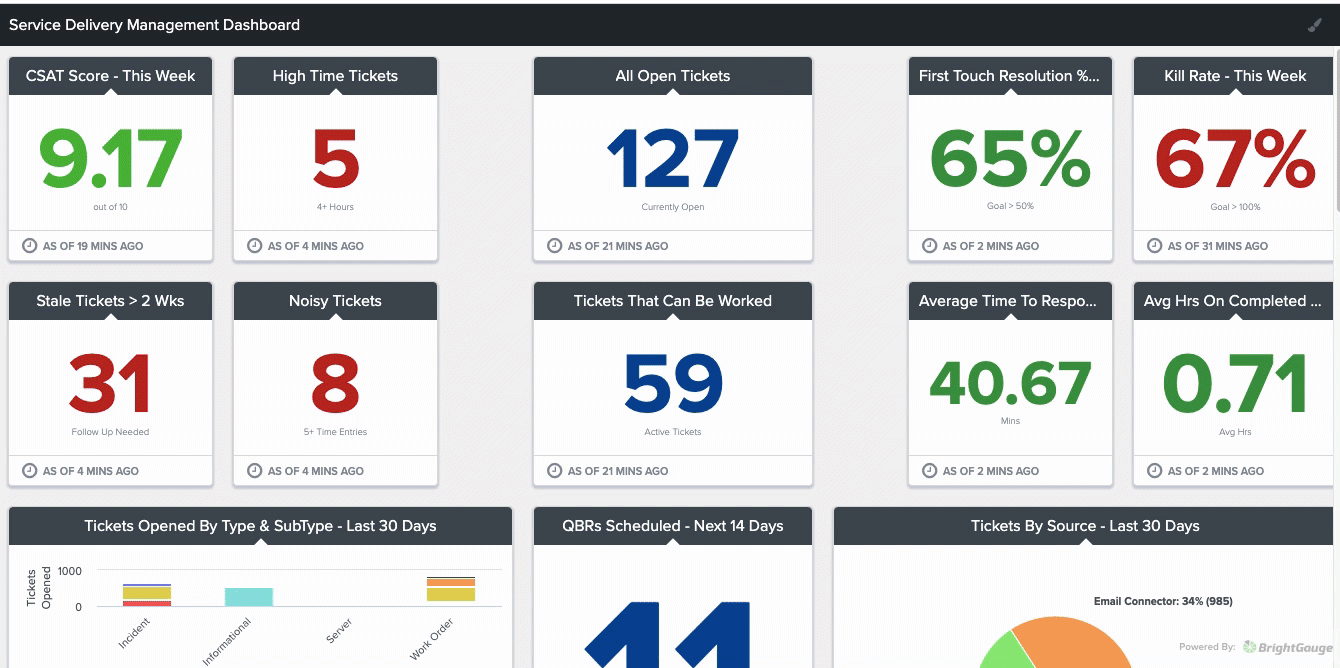
- Kill Rate % - This gauge is an easy-to-read metric that tells you if the team is closing more tickets than are being opened. If the kill rate is under 100% for prolonged periods of time, there is a good chance that the ticket backlog is becoming unmanageable.
- Stale, High Time, and "Noisy" Tickets - Across several gauges, these metrics help any service delivery manager quickly view potential problem tickets. This can enable them to step in proactively where needed to decrease resolution time.
- Actual Vs Billable Hours - Across two gauges, managers can get a quick view of the team's billable and/or client hours in comparison to the actual hours they are working. Many teams shoot for 80% billable.
- SLA Statistics - These gauges allow you to see what tickets are missing their SLA's and view the overall SLA adherence. This provides a quick view on whether you are overall hitting your response, resolution plan, and resolution time goals. You can also use these to proactively address tickets that fell short of their goals where needed.
- Utilization - Time management is perhaps the trickiest task for any service delivery manager -- making sure your team is entering all time, on time, and that every resource is equally utilized. These gauges provide a quick glance into what each team member has been doing, plus metrics to determine their billable utilization.
Thank you, Jeremiah, for collaborating with us and sharing insights on how your metric tracking practices have played a key part in your journey towards service delivery excellence!
Recreate in your BrightGauge
- Service Delivery Management Dashboard (public view link)
- Service Delivery Management Dashboard Buildout Key
Make sure to visit our library of more report and dashboard templates and please feel free to reach out to success@brightgauge.com with any questions!
Free MSA Template
Whether you’re planning your first managed services agreement, or you’re ready to overhaul your existing version, we've got you covered!
