I’ve written before about two of my favorite gauges being Number of Open Tickets and Closed Tickets in a given time period. You can derive so much information from these simple metrics which I go in depth about here. I’m excited to share that now with our Calculated Metrics release we are able to combine those metrics into a more meaningful gauge that we call the Kill Rate.
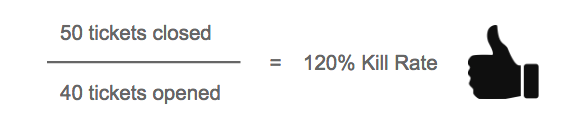
The formula for the Kill Rate gauge is Tickets Closed divided by Tickets Open over the same time period, usually per day. Anything above 100% means you have killed (completed) more tickets than have been opened. Let’s put this to the test:Scenario #1, it’s Friday and your service team is kicking butt and have a big catch up day of closing 50 tickets when there were 40 tickets opened by your customers. The formula to calculate the kill rate is:
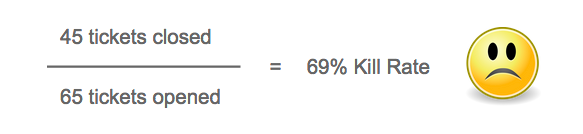
In Scenario #2, it’s a Monday and the team is getting flooded with tickets from the weekend so 65 tickets are opened by customers and your team is only able to complete 45 of them. The formula to calculate the kill rate is:
The beauty of this metric is one number brings a lot of information and in a quick glance you can see how your Service Team is performing. The goal is always to be reducing your service backlog (closing more tickets than are opened) which means you can target your team to keep the Kill Rate above 100%. It even helps to put an incentive in place if they stay above 100% for a certain number of days in a row, meaning they can go out and celebrate.
In the meantime, to learn how you can Improve Your Business with KPIs on Dashboards check out our free white paper: