In a world where data drives decisions, BrightGauge stands out as the premier analytics solution for Managed Service Providers (MSPs) & Technology Service Providers (TSPs), offering the tools and insights needed to excel. Empowering TSPs with Data-Driven Insights In today's fast-paced technological landscape, the ability to make data-driven decisions is crucial for the success of Managed Service Providers (MSPs) & Technology Service Providers (TSPs). BrightGauge is on a mission to empower MSPs by offering robust analytics tools that turn raw data into actionable insights. By leveraging BrightGauge, MSPs can monitor performance metrics in real-time, get proactively notified on threshold alerts, identify trends, and make strategic decisions that drive growth and efficiency. With BrightGauge, MSPs have access to a comprehensive suite of dashboards, reports, goals and proactive notification workflows that provide a clear view of key performance indicators (KPIs). This not only helps in tracking operational efficiency but also in identifying areas for improvement, thereby facilitating a culture of continuous enhancement. New Tools and Features: What's Fresh at BrightGauge In 2024, BrightGauge significantly expanded its native integration capabilities by adding support for five tools, including Acronis, Axcient, ConnectWise MDR, ConnectWise Asio, and Strety. These line of integrations highlights the critical need for monitoring endpoint status and backup recovery posture for business continuity. Notably, the integration with Strety allows BrightGauge metrics to power scorecards and create linked To-Dos and issues, marking BrightGauge's first outbound integration and reinforcing its leadership in providing comprehensive solutions for MSPs & TSPs. BrightGauge continually evolves to meet the dynamic needs of MSPs. This year in 2024, our Recent updates have introduced a variety of new tools and features designed to enhance the user experience and provide proactive insights & personalized visualizations to everyone at your organization. Proactive notifications workflows feature was made generally available in first half of this year. It enables you to create thresholds on metrics that you want to track based on threshold conditions. With flexibility to get notified on MS Teams, Email & Slack notifications, BrightGauge monitors these metrics and provide customizable & personalized alerts if metrics crosses the threshold. BrightGauge also introduced brand-new Dashboard management experience in Asio-neon theme which enables management of dashboards, filter on different fields, categories to organize, manage access to users at a single place. This also paves way to have access to BrightGauge dashboards from within AsioTM platform. Another exciting addition is the Sidekick for BrightGauge (currently in Early access), the AI-enabled chatbot enables BrightGauge users to ask questions in a natural language and MS teams-based Sidekick app provides summarized answers from the data sources connected out of 60+ supported integrations. This innovation makes BrightGauge the only MSP-focused analytics platform that truly integrates AI to deliver insights with your existing BrightGauge subscription. Personalized Insights for Every Role in the Organization At BrightGauge, we want to empower MSPs to provide personalized insights to everyone at your organization. We believe creating visible & measurable goals, providing visibility to different activities & its metrics that contribute to those goals makes people rally around the goals and often exceeding them. One of the stand-out features of BrightGauge is its ability to create Parent-child dashboards. Using a single Parent dashboard, you can create multiple clone child dashboards to provide personalized view tailored to needs of every role within an organization. Parent dashboards enable you to control and make updates to multiple dashboards at ease. Whether you're a technician on the front lines, a manager overseeing operations, or an executive shaping strategy, BrightGauge delivers the specific data you need to excel in your role. In last one year of launch of this feature, MSPs across the world created around 12000 dashboards from their parent dashboards fewer than 1800. That shows how easy it has made to provide either client-facing dashboards or technician specific dashboards. Why BrightGauge Outshines the Competition Central to BrightGauge's design principles is the ease of use and the empowerment of MSPs through self-service capabilities. BrightGauge distinguishes itself from other analytics solutions with its intuitive interface, extensive customization options, and strong integration features. Unlike many other platforms, BrightGauge is specifically crafted with TSPs in mind, ensuring that all features and tools are tailored to the unique challenges and needs of this industry. Integrations and features mentioned earlier in the blog are some examples of our focus for TSPs success. Furthermore, BrightGauge is committed to meeting the needs of MSPs worldwide. In addition to North America, BrightGauge now has data centers in the EU and AU, offering data localization options. With over 4,200 pre-built metrics and gauge templates, along with its seamless integration with other essential systems used by MSPs, such as PSA and RMM tools, BrightGauge enhances its value, making it an essential component of any MSP's toolkit. Looking forward in 2025 ConnectWise is dedicated to delivering the first and only true MSP platform, and as part of this commitment, more of BrightGauge's features will be reimagined with user-friendly enhancements in an Asio-neon theme, becoming available on the ConnectWise Asio platform. In the addition to new integrations, existing ones, particularly those with AsioTM solutions, will be more tightly integrated, ensuring seamless data access across the tools MSPs use within the platform. Next year, BrightGauge will introduce features designed to support the community and its needs, offering self-service capabilities for creating data views to generate domain-specific insights and foster community sharing experience.

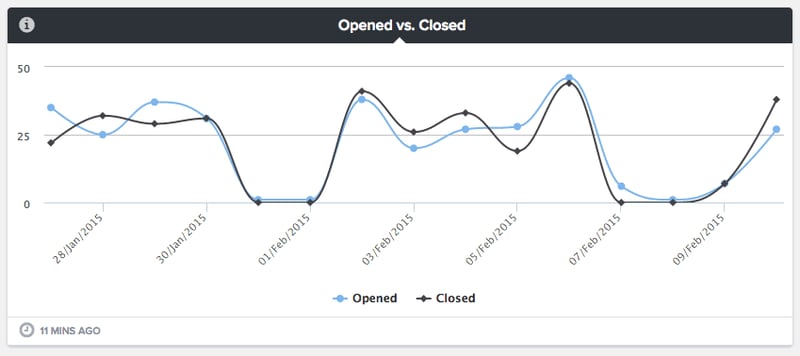
You know what clients love? Partners who are trustworthy and transparent about what they’re doing. Know what’s even better? When that foundation is set naturally, without clients having to ask. It’s likely a priority of yours to foster a really strong sense of trust between you and your clients, which is great. Trust breeds long-term relationships and repeat business, putting you on a path towards success. And a really simple, yet powerful way to build that trust is to get in the habit of consistently sending out client reports. It’s not as tedious or time-consuming as you may think, and the payoff is substantial. Determining what to report on Let’s say you’re using Autotask Professional Services Automation to track your support tickets, SLA data, engineers’ hours, and more. That’s some pretty important data! How do you show your clients what you do with that data to keep them running efficiently? This is where Autotask reports come in. Consistent reports give you the opportunity to visually display your value to your client and reinforce the reasons why they are paying you. Autotask reports also show that you’re proactive and committed to helping them run their business - a.k.a., you’re a partner, not just a service provider. However, while we are clearly in support of showing off your data management skills, we should caution against dumping too much Autotask data (or any data) on your clients. The key is to choose the right data. There are a few questions to ask yourself whenever you’re choosing the Autotask data to report on: How does this fit into my client’s SLA? Referring to the SLA you and your client agreed upon is an excellent way to refresh yourself on what matters to them. For example, if the SLA specifies a satisfactory support ticket response time, you’re going to want to include your Autotask Average Time to First Response on each report you send. Does this impact my client’s bottom line? Only include the Autotask data that’ll have the most impact to each specific client. They may not need to know nitty-gritty details like Hours Today by Engineer, but would probably appreciate an update on Projects Opened vs. Closed. Am I spending significant time on this? If it’s not something that matters a whole lot to you, it’s not likely to matter a whole lot to your client. Remember, this is an opportunity to report on your value, so show off Autotask data that you spend a worthwhile amount of time on. Once you’ve got your data ironed out, you can start pulling your Autotask reports together. A little help goes a long way You’re really busy. You don’t have 8-10 hours a week to spend on compiling reports. And no one says you have to. Using a business intelligence tool like BrightGauge can help you get your Autotask reports out with very little work on your end. First of all, BrightGauge takes all your Autotask data (plus data from your RMM, BDR, security, finance tool, etc) and puts it up on one seamless dashboard, so you can keep an eye on the metrics that matter to you in real-time. Then, when it comes to building reports, the whole process is automated and can be set up in just a few clicks. When you connect BrightGauge + Autotask, your account will come pre-loaded with 8 report templates to get you started, including Daily Member Scorecard, Weekly Project Work Summary, Service Calls, Sales Daily Wrap Up, and more. You can open one of these templates, personalize it with a client logo, choose your client recipient(s), and then schedule the report to automatically be sent out at the frequency you choose (like every Monday at 8 a.m.). If you’d rather build a report from scratch, it’s just a matter of dragging and dropping the data you’re already tracking into the report template, and then personalizing it and scheduling it out. It’s honestly that simple. And the reports look clean, professional, and digestible. Once you get your Autotask reports scheduled, you can rest easy knowing they’re automatically being delivered to your client’s inbox every week/month/quarter and that your client’s can rely on you and trust you to receive this information. High-five! By the way, in addition to 8 report templates, you’ll get almost 200 default KPIs and 9 pre-built dashboards to get you started. Some KPIs include: Amount on Invoices 90 Days Past Due Average Time to First Response Average Time to Resolution Breached SLA Summary Per Resource Customer Satisfaction This Month Leaderboard Opened vs Closed Tickets Project Phases - Current Month Tickets Assigned by Tech Tickets Completed This Week Leaderboard Tickets by Issue Type Watch this video to learn more about setting up and sending out reports. If you’d like to add Autotask to your stack of BrightGauge datasources, please contact us today.

Dashboards and reports play a vital role in streamlining data and extracting valuable insights. In the dynamic realm of endpoint management, it is imperative for Managed Service Providers (MSPs) to have real-time access to consolidated data from their array of tools, enabling swift action on behalf of their clients. Utilizing metrics not only aids in pinpointing areas for enhancement but also empowers them to enact precise strategies for advancement. In this month's featured Dashboard, we delve into RMM Overview metrics tailored to streamline endpoint monitoring and management. Our inspiration stems from a recent user showcase webinar featuring Nate Ginn, the Centralized Systems Manager at ESI Technology Advisors, who shared insights on leveraging ConnectWise RMM and ConnectWise PSA data for enhanced client management. Tune in to Optimizing Remote Monitoring and Client Management with Data to discover more on how Nate drives performance enhancements through data utilization. Nate and the ESI team rely on the RMM Overview dashboard to gain a snapshot into critical indicators like patch status, warranty updates, and disk space utilization, guaranteeing optimal functionality of their endpoints. This visual aid, shared among their team, helps them stay ahead of RMM tickets for prompt issue resolution as well. RMM Overview - Endpoints - view here. Here are some featured metrics: Ticket & Configuration Information - These segments organize RMM tickets based on their status, time spent, and attached configurations. It also offers a historical perspective on ticket volume, and provides insight into the endpoints and software under your management. Patching & Disk Space Utilization - These metrics provide valuable insights on missing patches, OS patch compliance rates, and disk space utilization percentages. These data points are crucial for addressing performance concerns and identifying potential security vulnerabilities. Thank you, Nate, for collaborating with us and sharing your valuable insights! Recreate in your BrightGauge RMM Overview - Endpoints Dashboard (public view link) RMM Overview - Endpoints Buildout Key Make sure to visit our library of more report and dashboard templates and please feel free to reach out to success@brightgauge.com with any questions!
