

Announcing the first integration to hit our growing stack in 2019!
We’re happy to say that BizRatings is now live and available to connect with.
BizRatings makes it easy to get your customer’s direct feedback with unique online survey solutions. Then, reviews are indexed so search engines can get the word out about your company.
When you integrate BrightGauge + BizRatings, you’ll get complete visibility into your team’s CSAT scores as a whole or per engineer, so you can always be sure you’re working hard to meet your customer’s expectations.
How to connect to BizRatings
It won’t take you long to get up and running with any of our datasources.
To connect to BizRatings, click on the green ‘Add a new Datasource’ button, found on your BrightGauge overview page.
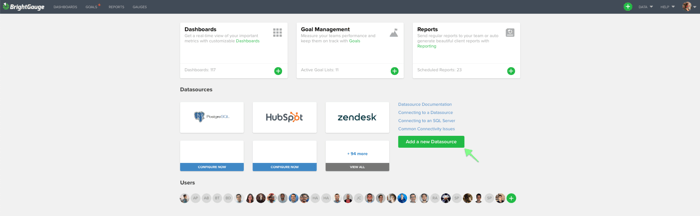
Find BizRatings under the ‘All’ or ‘CSAT’ categories, click on it, and follow all the prompts. Within a few minutes, you should be good to go.
If you need further instructions, check out our BizRatings support doc.
Not yet a BrightGauge customer? Contact our sales team today and we’ll be glad to walk you through a live one-on-one demo.
What do I get out of the box?
When it comes to your reputation and your customer’s reviews, it’s really helpful to have access to your data as soon as possible. Seeing your CSAT scores in real-time can help you figure out how well you’re meeting your customer’s expectations.
That’s pretty important.
Because of that, we took time to build out default gauges, dashboards, and reports, so you can get going as soon as you open a BrightGauge account.
With BizRatings, you get 22 gauges, 2 dashboards, and 1 report.
Gauges
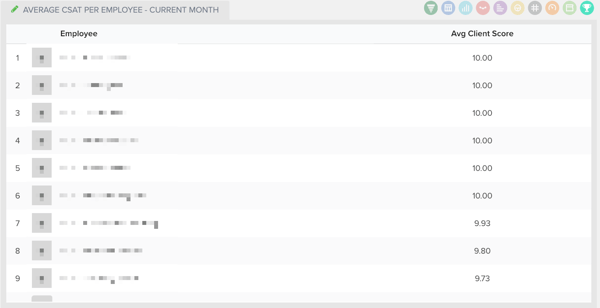
With your 22 default BizRatings gauges, you can keep track of things like CSAT score per company, employee, or board, average employee score, client response summary, outstanding scores, quarterly responses, response score summary, ticket response scores, and unsatisfactory scores.
Dashboard
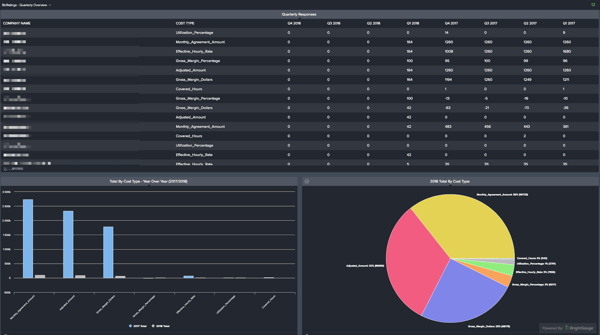
You’ll get 2 default dashboards with your BizRatings integration: Quarterly Overview and Responses Overview. Your Quarterly Overview will show cost type by company per quarter, cost by type year over year, and a pie chart that breaks down total by cost type for the current year.
Responses Overview gives your number of unsatisfactory and outstanding scores, a summary of responses, and response scores by tickets.
Report
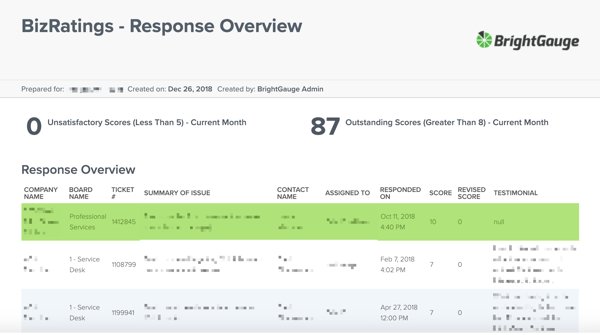
Custom reports are so great because they show a real sense of transparency between you and your team or you and your clients. With BizRatings, you get 1 default report, which is a Response Overview. This report summarizes your responses by company and shows how many unsatisfactory and outstanding scores you’ve received.
Anytime you’ve got a question about BizRatings, please submit a support request or contact us and we’ll be ready to help!

Free MSA Template
Whether you’re planning your first managed services agreement, or you’re ready to overhaul your existing version, we've got you covered!

