

When you’re in need of data, time is of the essence. You’re too busy to waste any time, especially when you have business decisions to make.
That being said, did you know that all BrightGauge integrations come with default gauges, dashboards, and reports that help you get started as soon as you connect?
That way, you can start viewing your data immediately while you familiarize yourself with BrightGauge a bit more.
You may be using BrightGauge + Webroot to stay on top of your cyber security efforts, which is more important than ever before. Here’s a look at what comes standard with every BrightGauge + Webroot integration.
Default Webroot KPIs
As soon as you connect Webroot to your BrightGauge account, you’ll find 36 default KPIs, 5 dashboards, and 2 report templates pre-loaded into your BrightGauge. Plus, if you’re an Enterprise plan user, you’ll get 5 additional KPIs.
Here are all the KPIs you can immediately start tracking with your BrightGauge + Webroot integration:
-
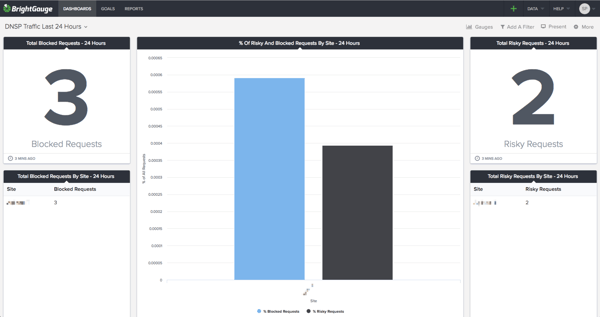
% of Risky and Blocked Requests by Site - 24 Hours*
-
Chart that shows the percentage of all requests, by site, that were deemed risky or were blocked
-
Active Endpoints
-
Lists all the endpoints you track, with details on the policy name, group, last infected date, active directory domain, and more
-
Active Endpoints (Snapshot gauge)*
-
Shows a historical trend of your number of active endpoints over time
-
Active Threats - Last Month
-
Displays the number of active threats you had in the last month, with the capability to drill down and see more details, like site name and number of threats per site
-
Active Threats - Last Week
-
Displays the number of active threats you had in the last month, with the capability to drill down and see more details, like site name and number of threats per site
-
Agent Version Spread
-
Pie chart that breaks down your various agent versions, with the capability to drill down and see more details, like site and host name, and keycode
-
Attention Required
-
Shows your number of sites with activity requiring your attention. Drill down to see details like site name, active threats, and the exact location of the latest threat.
-
Blocked DNS Requests (Snapshot gauge)*
-
Shows a historical trend of your number of blocked DNS requests over time
-
Blocked Requests by Category - 30 Days
-
Displays how many blocked DNS requests you’ve received by category in the last 30 days
-
Blocked Requests by Domain - 30 Days
-
Displays how many blocked DNS requests you’ve received per domain in the last 30 days
-
Blocked Requests by Hostname - 30 Days
-
Displays how many blocked DNS requests you’ve received per hostname in the last 30 days
-
Blocked Users Leaderboard - 30 Days
-
Ranks the number of blocked DNS requests per username in the last 30 days, with the highest number of blocked requests appearing first
-
Endpoint Protection
-
Lists full details of each of your endpoints, including hostname, policy name, last infected date, machine ID, IP address, current user name, and more
-
Endpoints by Group
-
Lists the number of endpoints you have in each of the groups you have created (ex: Desktops and Laptops versus Servers), with the capability to drill down and see more details on each of those endpoints
-
Endpoints by Policy
-
Lists the number of endpoints you have per each policy type you have, with the capability to drill down and see more details on each of those endpoints
-
Expired Status
-
Column chart that shows how many endpoints are in expired status versus non-expired status, with the capability to drill down and see the site, hostname, and keycode for each endpoint in either group
-
Global Policies
-
Lists your policy names and types, with more details like a description, setting, and date created
-
Global Policies for Sites
-
Lists all your site names, the policy on that site, and more details like number of endpoints per site and policy date created
-
Infection Status - Last Month
-
Lists the infection status and latest threat for each of your sites for the last month
-
Infection Status - Last Week
-
Lists the infection status and latest threat for each of your sites for the last week
-
Managed By Policy
-
Column chart showing how many managed versus non-managed endpoints you have, with the capability to drill down for more details
-
Realtime Shield Status
-
Column chart showing how many endpoints have protection enabled versus how many do not, with the capability to drill down for more details
-
Remediation Status
-
Column chart showing how many endpoints have remediation enabled versus how many do not, with the capability to drill down for more details
-
Risky Requests (Snapshot gauge)*
-
Shows a historical trend of your number of risky requests over time
-
Scan Count
-
Lists your number of scan counts per sitename
-
Scanned within a month
-
Lists the infection status of your endpoints that have been scanned, per sitename, within this month
-
Scanned within a week
-
Lists the infection status of your endpoints that have been scanned, per sitename, within this week
-
Sites
-
Lists details for your sites, such as deactivated status, infected status, name, number of seats on that site, keycode, and whether or not a global policy is attached to that site
-
Status
-
Lists the status of your endpoints, with details like hostname, policy, last seen status, attention/infection status, agent version, keycode, and operating system
-
Threat History by Site
-
Lists your threats by site, with details like first and last seen dates, endpoint ID, the filename associated with the threat, machine ID, malware group, and path name
-
Total Blocked Requests - 24 Hours
-
Shows your number of blocked requests in the last 24 hours, with the capability to drill down for more details
-
Total Blocked Requests by Site - 24 Hours
-
Lists your site name and number of blocked requests for that site in the last 24 hours
-
Total Infections (Snapshot gauge)*
-
Shows a historical trend of your total number of infections over time
-
Total Requests - 24 Hours
-
Shows your number of total requests in the last 24 hours, with the capability to drill down for more details
-
Total Risky Requests - 24 Hours
-
Shows your number of risky requests in the last 24 hours, with the capability to drill down for more details
-
Total Risky Requests by Site - 24 Hours
-
Lists your site name and number of risky requests for that site in the last 24 hours
* Denotes a KPI available to Enterprise plan users only
Dashboards
Your 5 default dashboards organize your KPIs into buckets, so you can easily view all related metrics in one single pane of glass. These dashboards include:
-
DNS Protection Blocked Traffic
-
Shows your Blocked Users Leaderboard, and Blocked Requests by Category, Domain, and Hostname
-
DNS Traffic Last 24 Hours
-
Shows Total Number of Blocked and Risky Requests, Blocked and Risky Requests by Site, and % of Risky and Blocked Requests by Site
-
Webroot - Endpoints
-
Displays important endpoint information, such as Active Endpoints, Endpoints by Policy, and Endpoints by Group
-
Webroot - Infection Status
-
Helps you be proactive towards infections by displaying Active Threats, Attention Required, and Scan Count
-
Webroot - Sites
-
Keeps your site information organized by showing Managed By Policy, Remediation Status, Expired Status, Realtime Shield Status, Agent Version Spread, and Global Policies For Sites
Reports
When it comes to your client’s endpoints, transparency is crucial. You must let them in on the good and bad of what you’re doing, so they can trust you to keep them protected. Sending consistent client reports is an excellent way to keep them in the loop and build upon that trust.
We help you get started with two report templates, ready for you to send out:
-
Webroot Monthly Status
-
Webroot Weekly Status
Both reports compile key KPIs - such as Attention Required, Active Threats, and Infection Status - into an interactive report that can be automatically sent to your recipients on the recurring date and time that you choose.
BrightGauge helps you stay on track
With these default KPIs, dashboards, and reports, you can remain proactive about your endpoints without any setup requirements on your end. As soon as you’re connected, you’ll have access to these crucial data points that impact your client’s day-to-day.
Of course, all gauges, dashboards, and reports can be filtered and customized to your needs, and you always have the option to build out your own metrics, but if you choose to use just your defaults, you’ll have plenty of critical information at your fingertips.
If you have any questions about BrightGauge and your integrations, please contact us today.

Free MSA Template
Whether you’re planning your first managed services agreement, or you’re ready to overhaul your existing version, we've got you covered!

