Enterprise Data Warehouse (EDW) and Snapshots Upgrade
Everything you love about the Standard Plan, plus some extra goodies - like Snapshots - to make you sharper, more efficient, and even more scalable. Snapshots
Not a customer? Request a demo
Dig even deeper into your KPIs with more complex data insights
Build historical data, see your PSA and RMM metrics on the same dashboard, and derive more precise results by performing calculations - all with the Enterprise Plan.

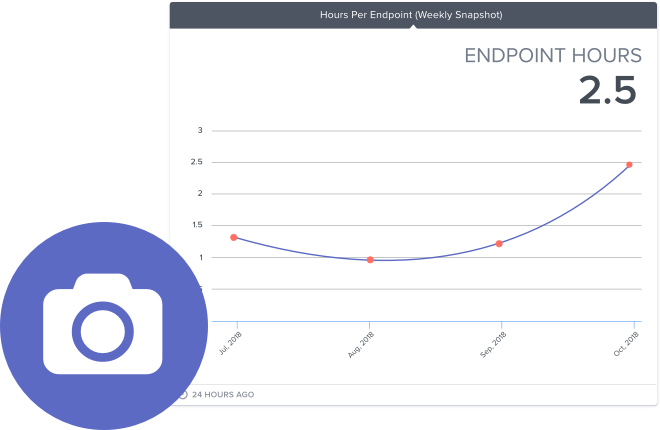
Data Storage With Snapshots
Our new Snapshots feature warehouses the data your PSA won’t and automatically captures your daily, weekly, or monthly numbers on one custom chart, so you can easily make comparisons, build historical records, and identify trends over time.
Use Snapshots to see whether your ticket backlog is shrinking or growing over time, to see what your sales pipeline is looking like, to track the progress you’re making on hitting your MRR goals, and more.
Forget creating multiple gauges to monitor your data points over time. Convert your number gauges to a snapshot and watch it happen automagically.

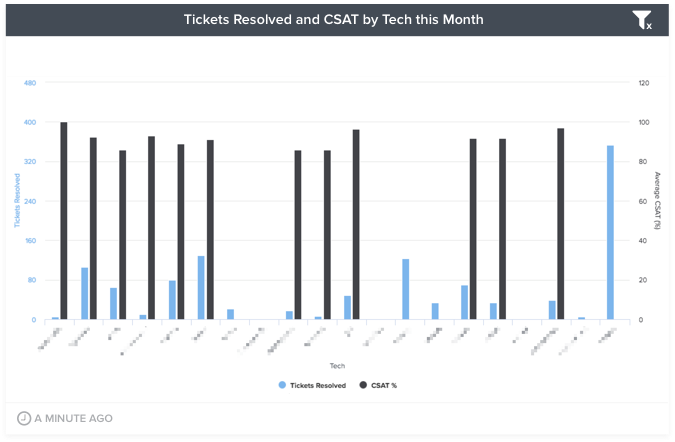
Datasource Mashups
With any of our plans, you can connect all the PSA, RMM, financial, and other tools you wish and see that data on multiple gauges, dashboards, and reports. But with the Enterprise Plan, you can put those metrics side by side in one seamless gauge.
It’s called
Perhaps you use ConnectWise Manage and SmileBack to track ticket statistics and customer satisfaction per technician. A
Calculated Metrics
Most of the time, Microsoft Excel scares us, but we’ve always loved the ability to calculate formulas within that tool. So, we took that concept and brought it to our Gauge Builder.
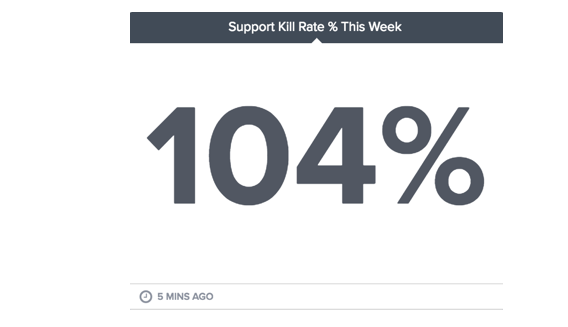
In the Enterprise Plan, you can create simple calculations between the layers in your gauge. For example, if you want to get the Kill Rate % of your tickets, you can divide the number of Tickets Closed Today by the number of Tickets Opened Today.
So, put your calculator away and let BrightGauge do the math for you. People will think of you as a data wizard no matter what.