Data Warehousing Lite
Create historical trends by taking a daily, weekly, or monthly snapshot of data you care about, like end-of-day ticket count or number of endpoints over time.
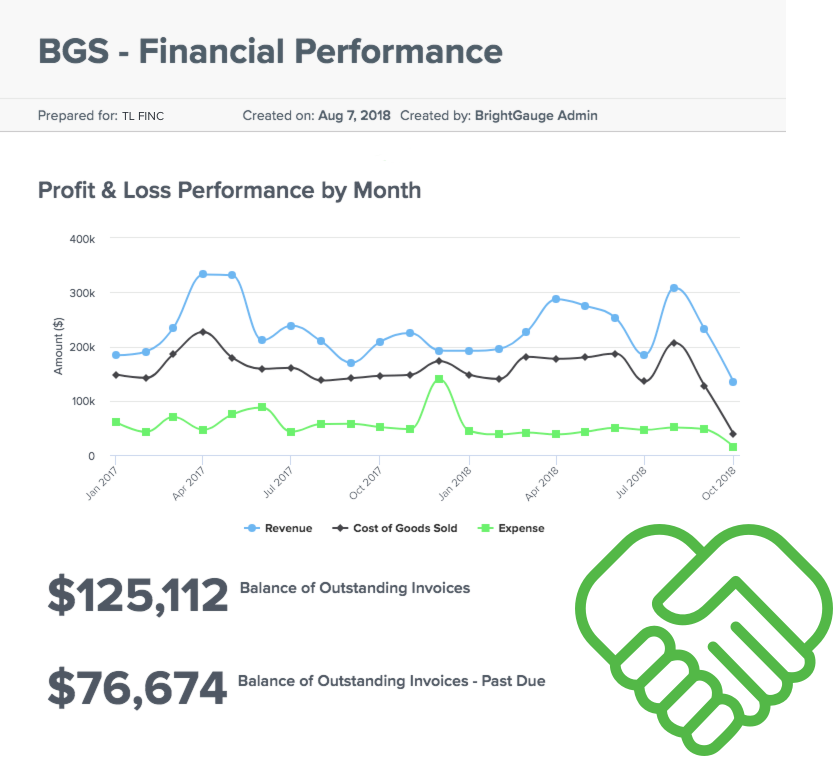
Put your KPIs on display
Important business insights from all your datasources are displayed in real-time dashboards, so nothing ever falls through the cracks; see your metrics right out-of-the-box with default gauges and dashboards.
Show value to your clients
Build a relationship based on trust and transparency through automated, custom, and interactive client reports; get started easily with pre-built templates.
Motivate your team
Establish a culture of accountability and drive daily motivation through team goal-setting, based on overall company KPIs; track goals on a weekly basis to measure team performance.