

Managing several employees, communicating important company metrics, and making sure your team stays productive are all crucial tasks to stay on top of, but can be time-consuming and difficult to juggle on a daily basis.
We’re all about solutions that can simplify our day-to-day lives, especially if it means we can improve our business in the process.
That’s the whole reason BrightGauge was created: to make it easier to manage your business and stay on top of your data.
With BrightGauge dashboards, it’s easy to stay on top of your data all day, every day. Ahead, we break down 8 ways that you can stay up-to-date with real-time dashboards.
Think of real-time dashboards as your business wingman
BrightGauge dashboards sync on a regular basis, which means the data you’re viewing is always up-to-date. Having a constant, real-time view of your data can really drive your business and make you a more efficient company. Once you understand how to utilize the power of data, there’s no going back. It’s pretty exciting.
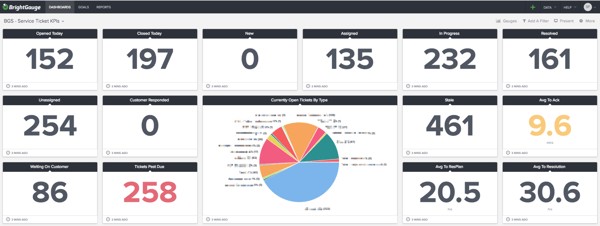
1. See ALL your KPIs in one place
BrightGauge integrates with many PSA, RMM, CSAT, finance, and backup tools on the market, such as QuickBooks, ConnectWise Manage and ConnectWise Automate, Webroot, IT Glue, LogicMonitor, and SmileBack. A full list of datasources can be found here.
The great thing about connecting your datasources to BrightGauge is that you no longer have to log in and out of multiple accounts or toggle between windows to see all of your crucial metrics. You can just view them side by side on one dashboard!
Tracking key performance indicators (KPIs) is an important part of business, but it doesn’t have to be a burdensome task. When you can access all of your data in one place and gain such a high level of visibility, it makes a noticeable difference in the way you operate.
2. Check on individual team member’s activity and performance
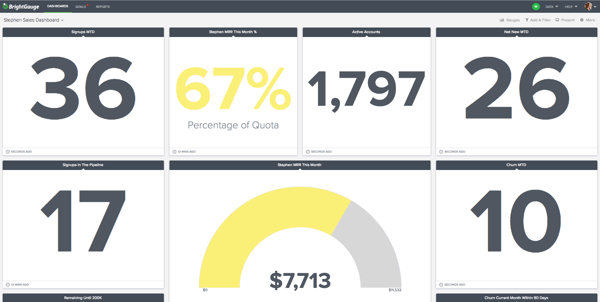
BrightGauge allows you to customize and filter your gauges and dashboards so that they return the exact specific information you’re looking for. Because of this, you can analyze your data for an exact moment in time, or even for an individual team member (pro tip: create one dashboard per each of your direct reports).
Let’s say you want to quickly see how one of your Support Techs, Danny, is using his time this week. Specifically, you want to see how many tickets he’s responded to, how many of those he has resolved, his average time to response per ticket, and his CSAT score. You can create a personalized dashboard made up of gauges with this pertinent info and take a glance at that dashboard anytime you need. In a moment, you’ll know exactly what Danny is up to.
Instead of relying on weekly status meetings and your team member’s memory to figure out what they’re working on and how they’re performing, you can turn to hard data. This is both a time saver and a more efficient way to manage your team’s activities.
3. Create a little healthy competition
Keeping employees motivated day after day, week after week, and year over year is definitely a challenge. At some point, you’ve got to resort to creativity to find new ways to keep them going. That’s how we landed on using dashboards to inspire some healthy competition.
Because dashboards are so visible, a lot of our customers end up displaying them on TVs around the office, so everyone can see what’s happening in real-time. Couple that with the fact that you can easily create leaderboards on BrightGauge dashboards, and you’ve got a recipe for some friendly competition!
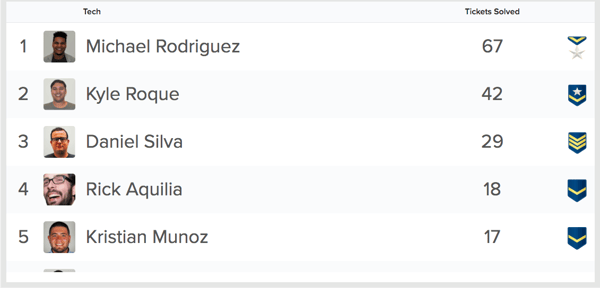
Scenario: your Tickets Solved number each week is not exactly where you’d like it. You want your team to hustle a little harder and close out those support tickets. So, make a game out of it. Throw all of your Support Techs up on a leaderboard where everyone can see it and incentivize them to solve the highest number of tickets in order to win a prize, like an extra PTO day or a free beer.
Everyone likes being #1, so you better believe your team is going to work really productively and efficiently to see if they can make it to that coveted top spot. Since they will all be putting in extra effort, your overall numbers are going to improve, so the whole company wins even though you’re only giving one tech that first place prize.
Nothing like a little friendly competition to put things on the up and up!
4. Make 1:1’s more productive
If you’ve got several direct reports, you’re probably meeting with them on a regular basis to check in and talk shop. The problem with these meetings is that they eat into your calendar and they rarely start or end on time.
Between getting sidetracked by chit-chat or not having a clear agenda, it’s likely that these 1:1 meetings end up being less productive than you had hoped. It’s okay, it happens to all of us.
Our recommendation: start each meeting with a BrightGauge dashboard. Create one dashboard per each direct report with specific gauges you care to measure. Have that dashboard on display as soon as your direct report walks in, so you can get a productive conversation started immediately.
You’ll be able to address issues, praise them for hitting goals, and strategize on long-term projects, all with the help of data. This leaves no room for vague discussions or unclear next steps (but maybe you’ll get a few extra minutes to talk about last night’s game).
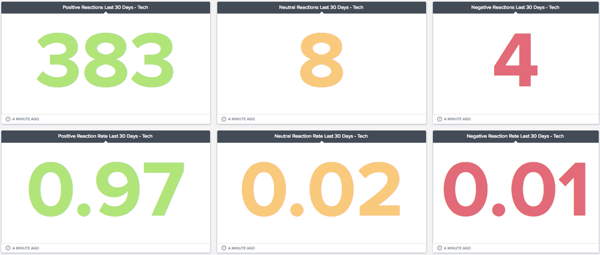
5. Get alerted to any urgent issues
One of our favorite features in our business intelligence dashboards is the ability to set up performance thresholds that alert you once they meet or exceed a certain number, so you can quickly detect issues as soon as they come up.
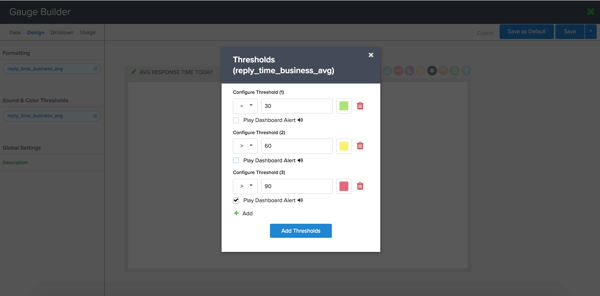
You can configure these thresholds to meet your preferences. A few customization options exist:
- set your threshold to be equal to or greater than a value you choose
- choose for the cell or row to change to a specific color once the threshold is met
- pick an icon to go with your threshold (i.e., sad face emoji, caution sign, check mark)
- set more than one threshold for the same metric, depending on how you want to be alerted
- for example, if you want to know if your average ticket response time is getting too high, you can set 3 thresholds: 1) the cell turns green and includes a happy face emoji if your number is equal to 30 minutes (this is your ideal number); 2) the cell turns yellow and includes a caution sign if your number is greater than 60 minutes (this is a warning); 3) the cell turns red and includes a sad face emoji and a bell sounds if your number is greater than 120 minutes (this is an urgent issue that needs your attention!)
With these visual and audible threshold alerts, everyone can be notified to issues, so you can take quick action in course-correcting and ensure that nothing is falling through the cracks.
6. Make data-driven business decisions
How are you accustomed to making a lot of your business decisions? Are you mostly relying on instinct? If you answered yes, and this has worked for you, then you’re lucky.
What you should be doing is using cold hard facts. Numbers don’t lie. They can’t be manipulated and they really do a good job of depicting a factual picture.
If you track data for years, it allows you to piece together patterns and trends that you can then use to make future projections or to predict future profit margins.
Data analysis provides meaningful insights that can help you make decisions on hiring or firing resources, scaling your business, setting KPIs, investing in new technology or continued education conferences and courses, rewarding employees with raises and bonuses, and so on.
In short, data can help you become a smarter and sharper business leader because it gives you actual evidence to base your next moves on.
7. Impress your clients
BrightGauge dashboards are pretty nice to look at, if we do say so ourselves. They are clean, impactful, and really pack a punch.
Imagine what prospective or current clients would think if they happened to walk through your office and saw a bunch of dashboards displayed on TVs throughout. They’d be like, “Wow, these people really have their shit together”. And who doesn’t want to make that kind of impression?
Being on top of your data and metrics makes you look proactive and like you really know what you’re doing. And here’s the kicker: having a data-driven mindset doesn’t just make you appear to be this way, it actually, truly does make you a business superstar. Yay!
8. Track your goals
We hope that you’re setting both short and long-term goals on a regular basis.
Goals are such a great way to make everyone come together to work towards a common good. They’re powerful drivers of accountability and motivation and they keep everyone focused.
By using BrightGauge dashboards, you can essentially track progress on your goals on a daily basis. Like we said before, data doesn’t lie, so it’ll show you the truth about where you stand, whether that’s good or bad.
Data - and tracking your goals through it - helps you stay on the course towards success, which is pretty great in our book.
Skimping out on the benefits that dashboards could bring to your daily life could really cause your business some damage. Data gives you a clear snapshot of what’s going on in your business and real-time dashboards show you that all the time. We can’t see any reason why you wouldn’t want in on that.
If you want to see BrightGauge dashboards with your own eyes, we’ll happily walk you through a live one-on-one demo.

Free MSA Template
Whether you’re planning your first managed services agreement, or you’re ready to overhaul your existing version, we've got you covered!

