
Are you an Autotask Professional Services Automation (PSA) user? We have some updates you may be interested in hearing about.
A lot of our users have talked to us about ways they feel our integration with Autotask could be stronger, and we’ve taken note. We’ve been hard at work making improvements that’ll help you get better data insights out of Autotask + BrightGauge.
These changes are now live, so we wanted to make sure you were in the loop!
Easy-to-create reports
Something we heard time and time again was that you wanted an automatic way to generate Autotask reports.
With BrightGauge, this couldn’t be simpler.
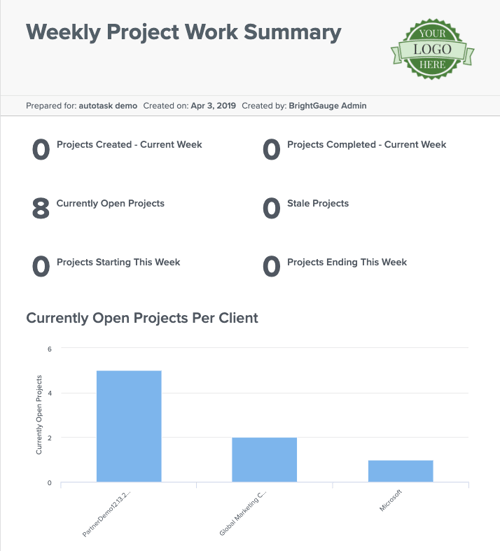
The reporting feature takes the Autotask data you’re tracking and converts it into custom, interactive reports with plenty of personalization options. You can add a cover page, your client’s logo, an image module, view the report in landscape versus portrait mode, and so on.
To add to that, the Autotask + BrightGauge integration comes with 8 report templates that are a huge time saver. They include a Daily Member Scorecard, Weekly Project Work Summary, a Service Calls report, and more. You can open a template, choose your client recipients, and send it off in just a few clicks.
Whether you start from scratch or use a template, you can schedule your reports to go out on a recurring basis to the clients you want, on the date and time you choose. Set it and forget it, but build trust with your clients all at the same time.
Default gauges
All available datasources in BrightGauge come with pre-built gauges, dashboards, and reports, so you can get to your data on day one. With the Autotask integration, you now get almost 200 default gauges pre-loaded into your account.
In other words, as soon as your account is connected, you’ll be able to start viewing lots of KPIs that matter to you and your business.
We’ve added a bunch of KPIs based on direct feedback from many of you.
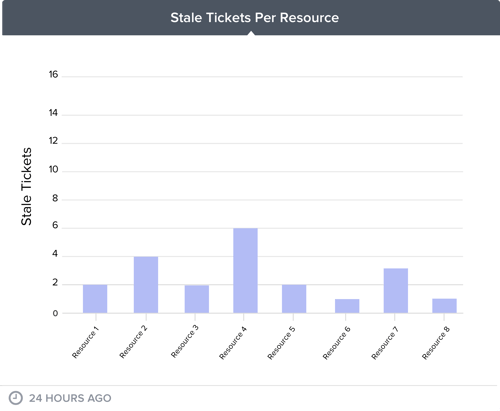
Highlights include SLA statistics filtered for business hours, Live Ticket SLA Data (see what’s about to breach), Service Call Details, and lots of KPIs pertaining to resources (like Tickets Due Today Per Resource).
Pre-built dashboards
You’re likely tracking multiple KPIs at the same time, so you’re going to want to see them side-by-side on a dashboard.
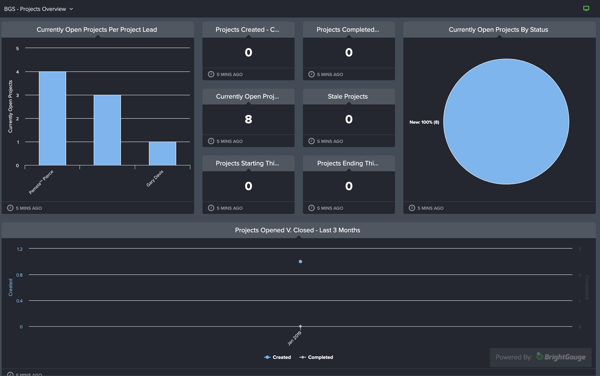
With the Autotask + BrightGauge integration, you’ll get 9 pre-built dashboards to get you going. They include a Member Scorecard Dashboard (gives great insight into employee efficiency), a Projects Overview (see tasks and projects by project phase), Service Ticket KPIs (everything you need to know about your tickets), and more.
Plus, if you use another PSA, RMM, BDR, finance, or other tool, you can see those KPIs right alongside your Autotask data.
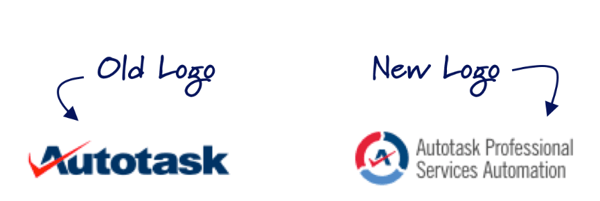
How do I know which version of Autotask I'm on?
In your BrightGauge, head to your datasources and take a look at the logo displayed. If the logo says 'Autotask Professional Services Automation', like the one shown below, on the right, you're on the most up-to-date version. If you see the old logo, then you'll need to migrate your data to the newer version of Autotask.
Watch this video to learn how to migrate your data from one datasource to another within BrightGauge.
If you want to learn more about these Autotask upgrades or want to get connected to BrightGauge ASAP, please reach out to our team. We’re happy to answer your questions and get you started.

Free MSA Template
Whether you’re planning your first managed services agreement, or you’re ready to overhaul your existing version, we've got you covered!

