

Undoubtedly, one of the most important areas of business any owner or manager wants to keep an eye on is financial performance. Simply put, you need to know the status of your cash flow, revenue, expenses, and more at any given moment.
Any executive or leadership team will look to view and analyze these kinds of metrics on a regular basis, to drive business decisions and forecast performance.
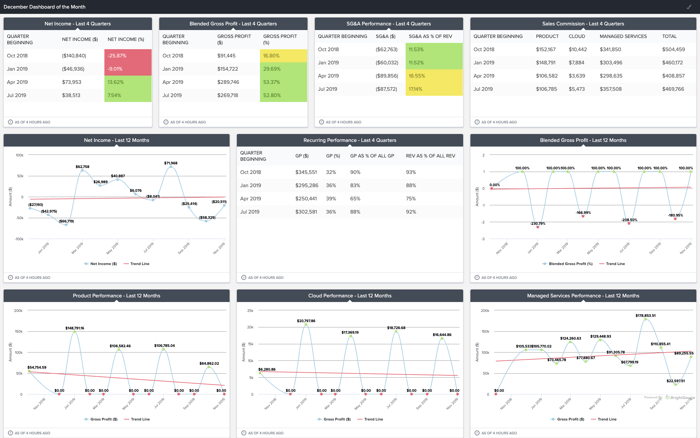
So, when building a financial overview or leadership KPI dashboard, what are the key metrics you are choosing to display? There are some key performance indicators that will resonate across the board, but others may be specific to your organization. To help shed some light, and maybe some inspiration, we spoke to BrightGauge customer Dan Lattuada of Pinnacle Technology Partners to learn what their Leadership KPI Dashboard looks like. The following is a recreation of the dashboard they use:
View this dashboard here.
For Dan and PTP, it's important to see how the company is doing financially on a trailing 12-month basis to ensure that they are heading in the desired direction.
To accomplish this, their BrightGauge dashboard is designed to look at specific areas of their business, such as sales, product, and managed services. For example, when it comes to sales, they want to make sure their commissions are in line with company performance.
The most critical metric on their dashboard is their recurring revenue, which is the bread and butter of the PTP business.
"We look at recurring revenue as our main KPI because, in any given month, we want to see that trending upwards," says Dan. "We're in the habit of optimizing the services our clients are consuming, but we want to make sure we are doing it in a way that makes sense for our overall business."
Within BrightGauge, Dan builds his gauges with multiple layers to return that recurring information. He cautions that in order to do that, you need to organize yourself within Quickbooks (or other financial tool) first.
When possible, gauges have thresholds set to them, which Dan sets based on a combination of where they think their business should be and past performance.
So just how often is Dan using this leadership dashboard? Along with his accounting manager, he's looking at it on a daily basis. Given that this dashboard is meant to inform upper management on company performance, they share their metrics with the leadership team on a quarterly cadence.
Interested in setting up a Leadership KPI dashboard like this for your business? Check out our Dashboard Key to recreate it yourself or feel free to reach out to success@brightgauge.com and we’ll be happy to help.
Thank you to Dan and PTP for sharing your insights!

Free MSA Template
Whether you’re planning your first managed services agreement, or you’re ready to overhaul your existing version, we've got you covered!

