
Time is money. There’s a reason you hear this phrase often.
As a business leader, the more efficient you are with your time, the better your business outcomes will be. Few things are more frustrating than spending a boatload of time on tedious, non-revenue-generating tasks, such as creating client reports.
While definitely important, generating a client report does not have to consume 8 hours of your week. BrightGauge can automate this task for you so you can focus on business growth efforts while still fostering client relationships that last a long time.
Converting ConnectWise Dashboards into Powerful ConnectWise Reports
If you’re like the majority of our customers, you are using BrightGauge to manage your ConnectWise data.
Whether you’re monitoring Ticket Response Time, Billable Hours, Open Purchase Orders, or Server Status, a ConnectWise dashboard through BrightGauge helps you see all your data in one place, so you can prevent important issues from falling through the cracks. After all, this is what your clients are paying you to do.
However, we understand the importance of long-term client relationships and how they can positively affect your business growth, so we always recommend being absolutely transparent with clients so that they see you as really trustworthy.
Our favorite way to do this is by sending client reports. ConnectWise custom reports show your clients exactly how you are or are not tracking against your service level agreements (SLAs). We love reports because they are direct and honest. You can’t manipulate them or fluff up your metrics because our ConnectWise reports pull in data directly from the gauges you’re already viewing.
Numbers don’t lie and showing your clients that you’re accountable, transparent, and proactive will prove to them that you are worthy of their repeat business.
Likewise, if used internally, ConnectWise reports can help your team run more efficiently because they give all team members visibility into important data and company key performance indicators (KPIs).
Some of our customers tell us they use ConnectWise reports at their weekly status meetings to take stock of the previous week’s performance and to create a plan of action for the current week’s projects.
ConnectWise reports also help executives understand what company growth has been like and can be used in forecasting numbers for the future.
All in all, this one task is pretty crucial in terms of company productivity, efficiency, and optimization. And with BrightGauge, you can create impactful and interactive ConnectWise reports in a matter of minutes.
How to Generate a ConnectWise Report
You’ll see how simple this is to do. In fact, not making the minimal effort needed to produce ConnectWise reports on a regular basis can end up costing your business a lot, so don’t skip out on this valuable BrightGauge feature.
From your BrightGauge home screen, click on ‘New Report’ in the Client Reporting card. You’ll be prompted to generate a report either for an internal team or for a client. Pro tip: if you need to send the exact same report to multiple clients, select as many clients as needed from your client list.
Next up, choose to create a report from scratch or from one of our pre-built templates (no matter which integration you connect with, we make sure to load your account with pre-built gauges, dashboards, and reports so you can get started right out-of-the-box).
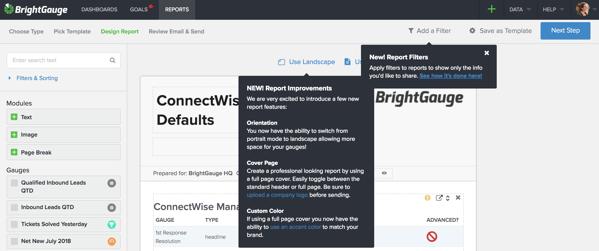
If BrightGauge updates have been made since the last time you logged in, you’ll notice new feature alerts that pop up in your app. We don’t want you to miss out on any improvements we’ve made, so refer to these pop-ups for tips on how to make your reports even better.
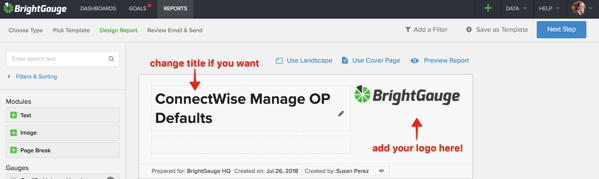
Once you populate your report with the metrics that matter most to you or your client, make sure you customize it by including your logo in the top right corner and by adding any context around data that may need further explanation.
Once you’re happy with your report, click on ‘Next Step’ to get to your email screen. Here, you can select as many recipients as you want (recipients will not see who else the email is sent to unless you cc: somebody, so don’t worry), change your subject line and body copy, and select whether to attach the report as a PDF and/or schedule the report to go out on a specific date and time or on a recurring basis.
When you finish up and hit ‘Send Report’, your report will automatically be emailed directly to your client’s inbox. And if you’ve scheduled it to send on a recurring basis, those reports will go out automatically, as well! All BrightGauge reports sync 10 minutes before they are sent out, so no matter what, your client will always see up-to-date metrics.
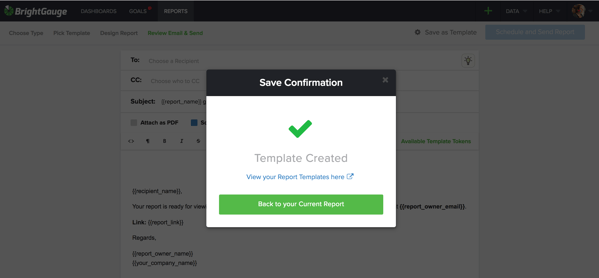
By the way, don’t miss our favorite reports feature: click ‘Save as Template’ to save this report to your files. Next time you want to send this to a new client, let’s say, you won’t have to go through the trouble of creating it all over again. Simply choose from your template and you’re good to go.
So, there you have it. In a few easy steps, you’ve created a ConnectWise report that’s definitely going to impress your client and keep you running efficiently. That’s what we call a win-win!
For more on the importance of building trust with clients, check out our free webinar, 'Client Reporting Best Practices’.

Free MSA Template
Whether you’re planning your first managed services agreement, or you’re ready to overhaul your existing version, we've got you covered!

