

Question: How many different programs, web-tools or items of software do you use a day?
Sure, all the tools you use add value. But with more tools comes more data points, more logins and, ultimately, more time spent analyzing trends and results.
If all your important data and KPIs could be monitored in one place, it would save you time and increase your productivity and efficiency, right?
That’s why business intelligence tools - like BrightGauge - matter so much.
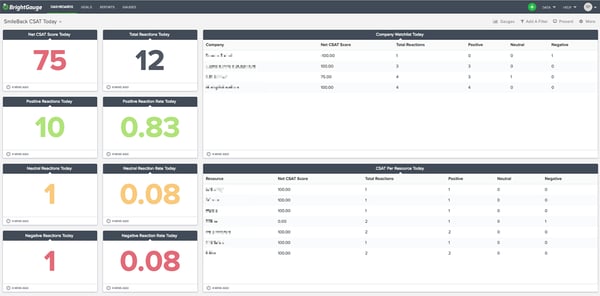
Even the customer satisfaction pros at SmileBack, and their clients, turn to BrightGauge to integrate all of their CSAT metrics into one single dashboard.
We spoke to Eben Marks, Customer Success Manager at SmileBack, to learn more.
CSAT pros putting their money where their mouths are
As the team behind a successful CSAT survey, it would be hypocritical if SmileBack didn’t track their own performance.
Within their own Customer Success department, the folks at SmileBack spend time keeping up to date with the total amount of support tickets they have, how many tickets have been replied to, and by whom.
“Quite simply, we needed one place where we could monitor support tickets, our own satisfaction scores and more in one place,” says Eben Marks, Customer Success Manager at SmileBack. “And that’s what we’re getting with BrightGauge.”
Through the data points they track, each team member receives a CSAT rating, which they use to improve processes.
By implementing BrightGauge into their daily use, the team at SmileBack has benefited from quicker, stronger insights into their CSAT data. With a simple glance at their dashboard at any point throughout the day, Eben and his team are able to assess if they’re meeting customer needs or if they may be falling short. They see their survey reactions in real-time, which empowers them to make immediate changes, if necessary. Overall, it has made the department more productive.
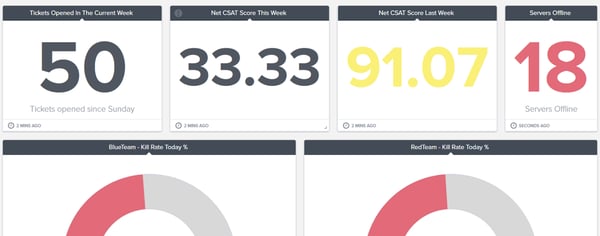
“Understandably so, some of our goals revolve around our CSAT performance. We’re also using BrightGauge to track those goals,” says Eben. “It’s a simple system because your relevant numbers for the goal you want to achieve are displayed in red or green, so you know quickly whether you’re on or off track.”
There are around 40 different datasources that you can display at any one time, making BrightGauge a powerful dashboard for the team to monitor, but also to display on TV screens or individual monitors if we need it.
"SmileBack integrates with BrightGauge, but we're also happy to personally use the integration ourselves because it has helped us understand our data better,” says Eben.
What SmileBack clients have to say
For Adam Hannemann, Director of Managed Services at Imagine IT, the SmileBack integration with BrightGauge is one of their key tools for daily work.
“We use BrightGauge for pretty much everything” says Adam.
Imagine IT has several users internally that essentially get their next work from a dashboard to make sure the right things are being worked on at the right time.
“We have TVs up in our service desk area that show dashboards specific to service-related items, then we have another dashboard for our Depot/Account Management/NOC that cycles through data relevant to those departments. We also have several users that dedicate a single monitor on their desk (our standard is 4 monitors) for a BrightGauge dashboard,” says Adam.
A KPI they’re constantly looking at on those dashboards? A running tally of their SmileBack scores, plus a week-over-week gauge. This helps them keep an eye on their streaks of positive reactions.
It’s a similar story for Edward Aronyk for MSP Keeran Networks, who could not do client reporting today without BrightGauge – at least not this easily.
“It’s very powerful, but also pretty straightforward to use. We’ve used competing products in the past but BrightGauge is way more brain friendly,” says Edward.
“With the SmileBack integration, we can include CSAT data in our QBR reports for when we sit down with our clients, and the monthly summary reports we email them. SmileBack can print a nice report too, but I like that BrightGauge integrates all of our datasources into a single report.”
About the SmileBack + BrightGauge integration
When you integrate SmileBack + BrightGauge, you’re going to get 34 default KPIs, 3 pre-built dashboards, and 2 report templates to get you started. That way, you can start viewing your essential CSAT data (and data from your RMM, PSA, finance, or other tool you’re using) immediately.
Some of the default KPIs that come with the integration include:
- Average CSAT % Last 90 Days
- CSAT Per Resource
- Days Since Last Negative Reaction
- Net CSAT Score
- Positive Reactions
- Total Reactions
To learn more about SmileBack + BrightGauge, please contact us today.
For more on why CSAT surveys matter and how to create effective ones, download our whitepaper ‘Customer Satisfaction Surveys That Work’.


Free MSA Template
Whether you’re planning your first managed services agreement, or you’re ready to overhaul your existing version, we've got you covered!

