

This is one of my favorite metrics to measure. The number on it’s own doesn’t tell you much, however, it is a great trending indicator. At Compuquip, we were all about converting our legacy clients to Managed Services, the magic MRR. So we monitored this on a regular basis to track our progress. We broke it down into 4 categories:
Monthly Recurring Revenue (MRR)
Anything that we billed for a fixed scope, on a monthly basis, based on a long term contract was considered MRR. This is probably more broad than other companies might categorize it but to be honest, it was a pain to break it out even further. We sold our services as a single monthly “all you can eat” fee. So if a customer signed up we would consider it MRR. Even if it meant staffing was included (more on that another time).
Professional Services Revenue
Any other services that wasn’t a monthly contract fell into our Professional Services bucket. That meant any project revenue, fixed fee or not, T&M work, pre-billed work, non-contractual staffing, etc. (This tended to be the most difficult to predict and plan for but we eventually found our baseline)
Hardware & Software (aka Procurement)
Anything that we “marked up and resold” from a 3rd party manufacturer that was not monthly recurring would land in this bucket. Typical margin was in the 15.0% - 16.5% range. I’m sure we could have charged more but our process was to charge a 20% gross margin as the default and anything that went below 15% required Management approval. Some of the larger deals, above $100,000, tended to bring down the average. Sales people were paid on the spread so the more they charged the more they made.
Other Revenue
Everything else fell to this category. All the the 3rd party referral fees, shipping and handling, rebates, etc. I know some companies would bundle shipping & handling into Hardware/Software but I wanted a true picture of the revenue for that line item. Plus, Other Revenue was compensated differently.
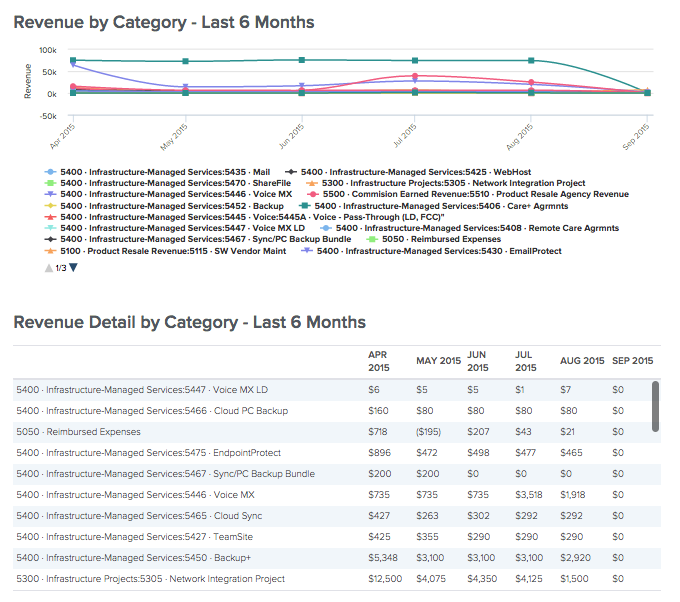
an example of tracking Revenue by Category in BrightGauge
Everyone seems to track financial statements a little different and it wasn’t until we became part of HTG Peer Groups that we standardized based on the template provided by Service Leadership.
I believe the key is to develop the metrics you want to measure. Start with the baseline to see how you’re performing and then as you take action to adjust your business, monitor the progress. This isn’t rocket science, but without knowing where you’re starting from it’s very difficult to know how you’re performing. Revenue By Category is a great metric to help understand which direction the ship is going.
To put it in perspective, at Compuquip we historically had a revenue split that looked like:
- Managed Services (MRR) - 40%
- Professional Services - 20%
- Hardware/Software - 38%
- Other Revenue - 2%
This blog is part of our Internal Metrics That Matter For MSPs blog series; you can download the free white paper here:


Free MSA Template
Whether you’re planning your first managed services agreement, or you’re ready to overhaul your existing version, we've got you covered!

