

Business owners are constantly thinking of ways to succeed. If you ask them to name one of the most important things they keep track of, they might say “our KPIs”. And we agree with that.
Key performance indicators, or KPIs, are a North Star. They tell us what we should work on and what our focus should be. They are how we determine whether we are hitting our goals or not. They help us to see how and where we can grow. Basically, KPIs keep us in check.
In the midst of the daily grind, it’s possible to let KPIs (and their progress or lack thereof) fall through the cracks. That’s no bueno. How do we fix that? One way is through (literal) visibility.
How to set KPIs
Before we dive into keeping KPIs visible, let’s backtrack a little. First, we’ve got to understand how to set KPIs in the first place.
It’s safe to assume that we all get why KPIs are so important. If you need more clarification, imagine this scenario: you are the commander of an army. You lead your troops into battle without telling them where you’re going, who you’re fighting, or what you’re fighting for. You simply say, “go”. Can you just picture your soldiers’ confusion? Where would they go? How would they differentiate an enemy from an ally? How would they know why the enemy is an enemy? Going into battle with no direction or purpose (aka KPI) is futile. There’s no why. You may as well be trying to put out a fire by adding gas to it.
Though it’s a dramatic metaphor, it paints a clear picture. Trying to run a company without establishing the ‘why’ is a great way to ensure failure. Your employees (your “troops”, if you will) need a reason to come back to work every day. It’s not just about earning a paycheck, it’s about helping your customers make some area of their lives better.
Best practices for setting KPIs
- Be deliberate. Why do you do what you do? Therein lies your driving force.
- Know where you want to perform. When you’re aware of what areas you’d like to monitor performance in, it’s easier to plan for growth. Usually, the big three include finance, sales, and marketing (but there are, of course, more areas).
- Establish a type. Is your KPI quantitative or qualitative? In other words, can you measure an actual numerical value or are you using other data (like, say, CSAT score)?
- Be specific. This is not a time to be vague. Want to increase Gross Profit Margin? Set an actual number so that you have a true benchmark to track progress against.
- Think big. KPIs should be about long-term strategies. This is the time to think about your company’s bottom-line. For granular, nitty-gritty details, you’re better off setting short-term goals (that always tie back to your KPIs).
We’ve covered the basics, but there’s actually a lot that goes into setting and measuring KPIs, so be really strategic and careful in the process. You’re likely investing a lot of time and money into creating a business, so be calculated in the steps you take to become successful.
Keep KPIs front and center
You probably have regular town-halls and company-wide meetings that function as status updates regarding your overall KPIs. While that’s an awesome way to keep everyone in the loop, it’s not a bad idea to keep KPIs in everyone’s face every day. We mentioned earlier that they are a North Star, so you really want to be able to look up and see that star in the sky each and every day.
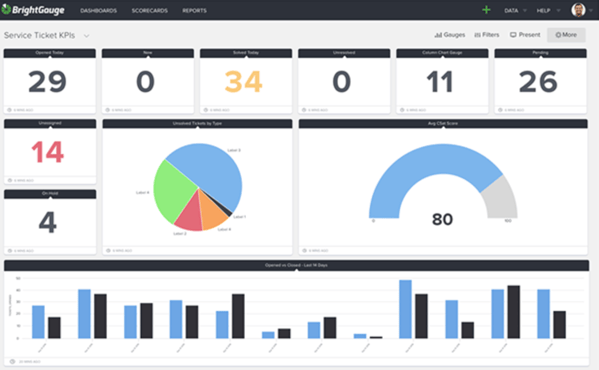
How do we do that in a way that’s exciting and motivating? Throw them up on some good-looking dashboards!
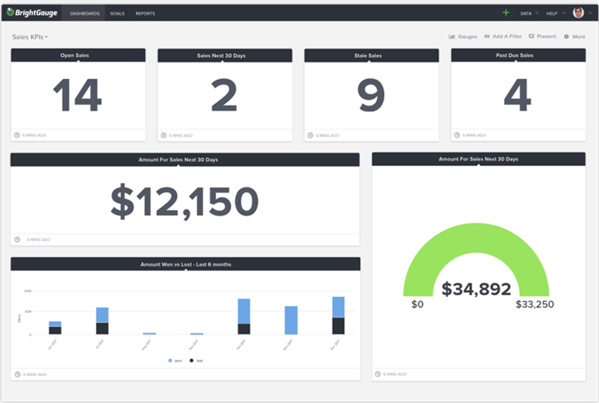
Visual cues are super powerful. Do even the slightest research, and you’ll learn that our brains process visuals really quickly and efficiently. By displaying your KPIs on a dashboard for everyone on your team to see, there’s no way to miss what’s happening in real-time. Things that need immediate attention will be obvious, goal progress will be trackable, and accountability will be very real.
An added bonus to dashboards is that they just look good. Display them on TVs around your office and watch what happens when clients come in for a visit. It’s almost a guarantee that they’ll comment on how impressed they are by your proactiveness and awareness.

BrightGauge makes visibility really simple
Customers tell us that they love how easy their BrightGauge is to use and they also love that we integrate with so many popular tools, like the ConnectWise suite, IT Glue, Kaseya, datto, Autotask, zendesk, GitHub, and more.
Depending on which PSA, RMM, or other tool you integrate with, your BrightGauge will come pre-loaded with several ready-to-use Dashboards and Reports to help you get started. We’ve compiled the top KPIs and metrics used by other clients to bring you a toolset in line with your KPIs.
We’re really proud of our Support team. They’ve put together an extensive knowledge base that will guide you through many frequently asked questions. Beyond that, if you need help building more complicated gauges, figuring out what to display on your dashboard, or getting a different answer to your question, the support team is just a ticket away.
We think dashboards are a game-changer. They save time, increase transparency, drive accountability, make you more efficient, and they make you look good. Want to learn more about establishing the right KPIs for your MSP? Check out our white paper, Internal Metrics That Matter For MSPs, for our tips.


Free MSA Template
Whether you’re planning your first managed services agreement, or you’re ready to overhaul your existing version, we've got you covered!

