

Do you send reports on a consistent basis? We’re big fans of reports because they’re a reliable source of truth. They show your clients or your internal teams exactly what you’ve been working on and the results of that work and, because of that, they’re great for building a solid foundation of trust.
We love seeing how our partners are using BrightGauge reports as a business growth strategy and as a way to keep teams accountable. This month, we’re sharing an Internal Weekly Service Report, as used by Joe Ensalaco of JT Global Enterprise, a systems integrator operating worldwide with offices in the UK and the US and specializing in Unified Communications, Customer Engagement, Digital Transformation, and Smart Retail.
Joe, the Service Operations Manager, built this report as a way to keep track of what his team did the previous week (he actually built this within 2 weeks of becoming a BrightGauge partner - impressive!).
“By looking at certain metrics on a weekly basis, we’re able to understand the circumstances around an influx in tickets, or a lack of support, so we can be proactive about preventing service issues in the future,” explains Joe.
His Internal Weekly Service Report focuses on both customer metrics and service desk metrics.
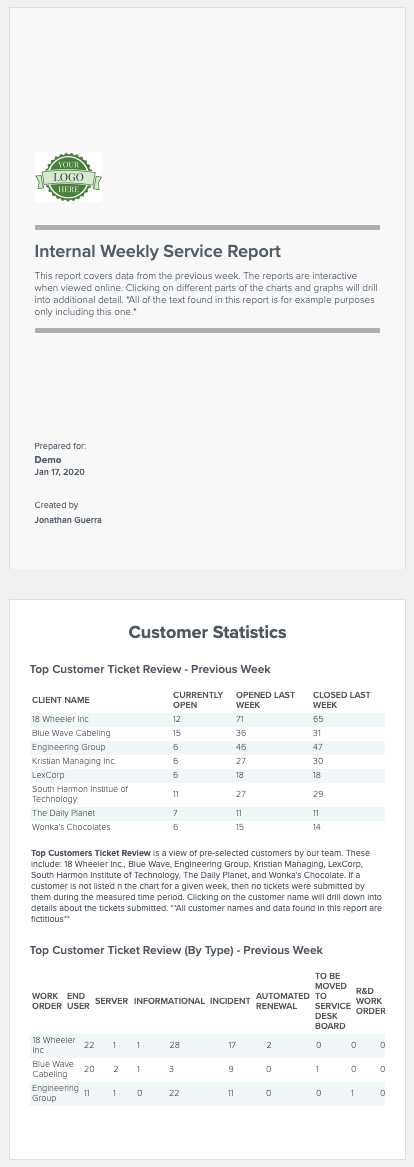
*This is a sample report for illustrative purposes only; not an actual report prepared by JT Global.
On the customer end, Joe and team are looking at who the busiest customers of the week were, how many tickets they opened versus closed, and what type of tickets are being opened. Knowing who their most active customers are helps drive cost management decisions and also indicates whether JT Global should train their customers in how to self-solve repeat issues (for example, building out phone extensions).
On a service desk side, Joe’s looking at what the whole support team is doing in general. Key identifiers include Ticket Kill Rate, Average Time to Resolution and Acknowledgement, SLA Stats by Priority, and Planned Works & Change Requests.
“For each metric we look at, we’re setting goals and thresholds so we can hold ourselves accountable to a specific benchmark,” says Joe. “For example, SLAs for most of our customers are 30 to 60 minutes, so we look at these numbers each week to make sure we’re on track.”
For Joe and the JT team, BrightGauge has enabled them to automate 90-95% of what was previously in their manual reports, obviously saving them a ton of time and letting them get back to focusing on their business.
Interested in setting up an Internal Weekly Service Report for your team? Check out our Report Key to recreate it yourself or feel free to reach out to success@brightgauge.com and we’ll be happy to help.
Thank you to Joe and JT Global for sharing your insights!

Free MSA Template
Whether you’re planning your first managed services agreement, or you’re ready to overhaul your existing version, we've got you covered!

