
Raise your hand if you love new integrations.
To be honest, we get really pumped about announcing new datasources we’ve added.
Our latest is a big one: Auvik! Many of you have been anticipating this and we’re happy to tell you that it’s now available to connect with.
Auvik is an efficient and profitable way for MSPs to manage network infrastructure by providing awareness about network devices and notifications for events, usage, and health stats.
When you integrate BrightGauge and Auvik, you get the visibility you need to stay ahead of network issues and protect your client’s business operations.
How to connect to Auvik
Important note: Auvik API access must be first granted to your account in order to get started with this integration. To do this, please contact your partner success manager at Auvik and request access.
Once you have access, it takes just a couple more steps.
When you’re in your BrightGauge overview page, click on DATA to get the dropdown menu, then select Datasources.

Select Auvik from the RMM category, follow any prompts, and that should get you set up.
If you’re looking for more detailed instructions, please check out our Auvik support doc.
Want to sign up for BrightGauge? Contact our sales team today to schedule a live one-on-one demo.
What do I get out of the box?
It’s quite important to have access to your data right away, because you’ve got work to do!
This is especially true when it comes to something as sensitive as your client’s networks. So, when you integrate with Auvik, you’re going to find 20 pre-built gauges, 5 default dashboards, and 1 default report to help you get things started.
Gauges

The default gauges that come with the Auvik integration involve all the details surrounding your client’s networks. Gauges include Device Details, Entity Audits by Week, Interfaces by Op Status, Offline Printers, Servers, and Workstations, Scan Status by Network Type, and Total Devices.
Dashboards

These pre-built dashboards break up your network statistics into different buckets to give you a 10,000 foot view of your important metrics. The 5 dashboards are Devices, Entity Audits, Entity Notes, Interfaces, and Networks.
Report
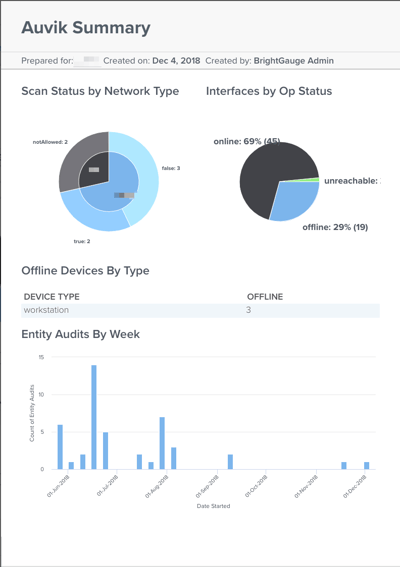
One default report will give you a running start on being transparent and building up trust with your clients. The Auvik Summary compiles your client’s network metrics and shows them exactly how you’ve been keeping things running.
If you’ve got questions about our Auvik integration, please feel free to submit a support ticket or contact us and we’ll be happy to help you out.

Free MSA Template
Whether you’re planning your first managed services agreement, or you’re ready to overhaul your existing version, we've got you covered!

