

Note: For the most current plan information, please visit our Pricing page.
We pride ourselves in offering our customers plans that are tailored to their needs, but sometimes a little extra information goes a long way when it’s time to pick the plan that’s best for your business. So, let’s take a closer look at the differences between our Standard, Enterprise (formerly known as Advanced), and Enterprise+ plans as shown on our pricing page:
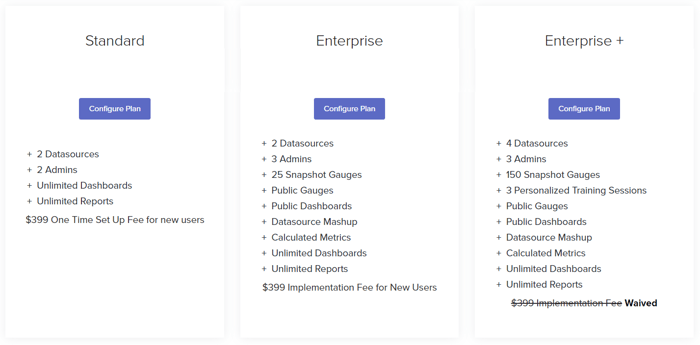
The main differences to note between our Standard and Enterprise plans are in the features offered:
- Number of datasources included
- Additional User Licenses
- Admin/Analyst User Permission
- Dataset Mashup
- Calculated Metrics
- Snapshots
- Public Gauges + Dashboards
- Training Sessions
Additional Datasources and User Licenses
Both Enterprise plans include 1 extra Admin User Account (for a total of 3 Admin Users). An Admin has complete access to the BrightGauge platform to create gauges, dashboards, and reports. Admins can also manage the permissions of Analysts in our Enterprise plans. You are able to add additional admin users as necessary. For pricing, please see the 'Extras' section of our pricing page.
The Enterprise+ plan includes 2 extra datasources, allowing you to connect 4 of the tools you're already using. On any of our plans, should you need to connect additional datasources, you can absolutely do so! For pricing, please check out the 'Extras' section on our our pricing page.
Admin/Analyst User Permissions
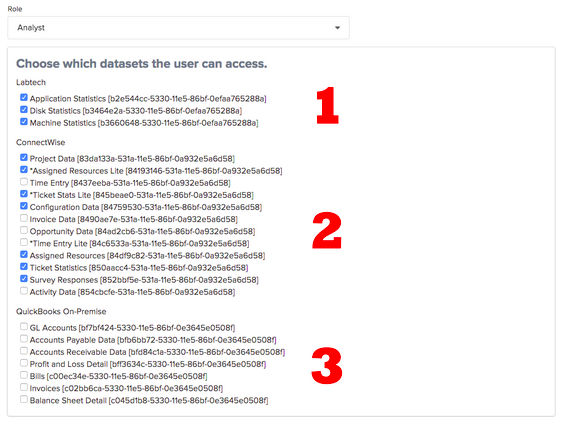
In the Enterprise plans, you have the ability to limit users by creating them as Analyst users. Analyst users are limited by the datasets the Admins give them access to. For example, in the image below you’ll see 3 different types of access for datasource:
- ConnectWise PSA (formerly ConnectWise Manage) - The Analyst has full access to the data (all datasets selected)
- QuickBooks - The Analyst has partial access (only some datasets selected)
- SmileBack - The Analyst has no access (no datasets selected)
Dataset Mashups
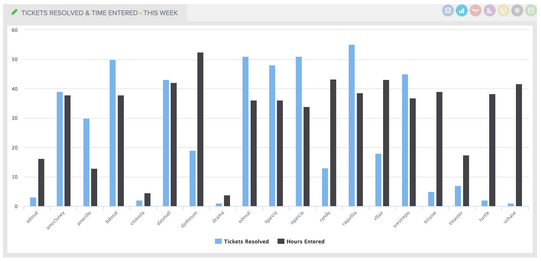
This is an often overlooked but very powerful feature. Standard plans can create layers using the same dataset (using different filters on each layer), but Enterprise accounts can create layers from different datasets and even different datasources. Layers are a great way to look at different groups of data, so the ability to see data from different datasets and different datasources provides more context into your data. Want to look at tickets resolved and time entered by technician? That’s a dataset mashup. Want to compare tickets opened to machines monitored? Again, a dataset mashup.
Calculated Metrics
Our Calculated Metrics feature allows you to create simple, yet powerful calculations using the common arithmetic operators like addition (+), subtraction (-), multiplication (x) and division (/).
Here are a few of our most popular examples:
1st Touch Resolution - Number of Tickets Resolved in First Touch (Layer 1) divided by Total Number of Tickets (Layer)

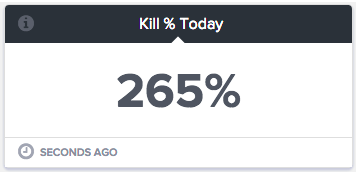
Kill Rate - Number of Tickets Open (Layer 1) divided Number of Tickets Closed (Layer 2)
Service Gross Margin - first calculate Service Gross Profit (Total Services Revenue minus Total Services COGS) then divide that by Total Services Revenue.

Snapshots
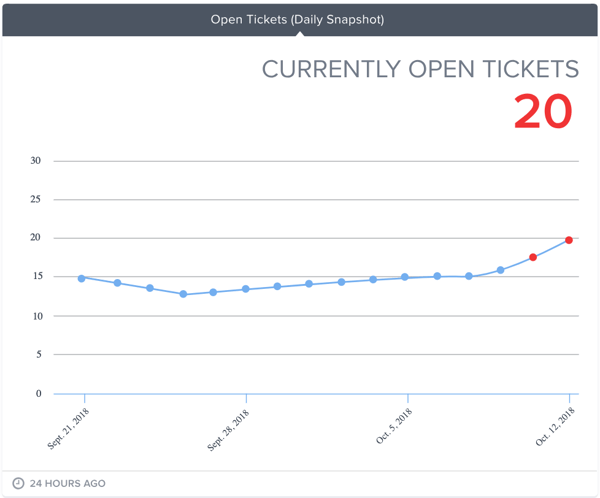
Our Snapshots feature will allows you to create historical trends on the data you care about most. It's a way to store the data that your PSA or other tool won't. For example, you can set your Snapshot gauge to capture your end-of-day-ticket count, plot it onto a chart on a daily basis, and show you your ticket trends over time.
Public Gauges and Dashboards
You can now share your data publicly, such as on your marketing site or in client portals. Perhaps you'd like to show your prospects your average CSAT score, or maybe you'd like to emphasize your average ticket response time. These KPIs can now be made public on the site of your choice.
Training Sessions
Talk to any of our partners and they will assure you that our support is unmatched. We really care about helping you solve your problems quickly and personally, regardless of whatever plan you've chosen. Every one of our partners will receive support and guidance during their onboarding period. However, those on our Enterprise+ plan will have access to additional one-on-one training sessions. Plus, our Enterprise+ plan includes one pass to a Data Driven Workshop, where you'll get advanced training and be able to network with other partners to share best practices and strategies.
As you’re considering the standard or enterprise plans, make sure you weigh out the features that are most important to you. For example, if you have a team that will share management responsibilities within the platform or you want to display PSA and RMM data simultaneously in the same gauge, our Enterprise plans will be your best match. On the other hand, if you’re the sole person in charge of managing data or only have one source to wrangle, our Standard plan will be the business intelligence boost you need.
Don’t forget, we are continually adding new features to our plans so please make sure to stay tuned for additional announcements or visit our pricing page for the latest info.


Free MSA Template
Whether you’re planning your first managed services agreement, or you’re ready to overhaul your existing version, we've got you covered!

