

Setting the right key performance indicators (KPIs) to guide and motivate your various teams is a big undertaking. You’ve got to look towards the future and decide what growth and success will mean to you and your employees. The right KPIs will help you lay down a solid foundation for building your organization.
As we’ve said before, KPIs and trackable metrics will be different for each team in your company. What you look at for your sales team will vary for your financial team, your marketing team, and so on.
When it comes to your service team KPIs, there are many different metrics to keep your eye on, and we’ve rounded up the top 8 just ahead.
How we determine top KPIs
Before we reveal the top 8 service team KPIs, it’s helpful to know how we’ve landed on them.
We gather our information in a few ways - looking at industry benchmarks, relying on our years of experience in the industry as MSPs and business owners, and listening to what BrightGauge users like you have said.
Because BrightGauge lets you put your KPIs and insightful data in one place with gauges, dashboards, and reports, we’ve seen what many of you are using the app for. When we’re researching the popular integrations to add to our roster, we analyze the type of data you’re looking to gather from these tools.
This helps us build a better app for you that you can use right out of the box and it helps us put together insightful information that, we hope, will grow your business and make your lives a bit easier.
For instance, your team is probably using a PSA like ConnectWise Manage to run their service desk and, by integrating with BrightGauge, are able to see their critical KPIs update in real-time so that nothing falls through the cracks. This kind of visibility allows you to respond to issues lightning fast and course correct before any major disruption in day-to-day operations takes place.
8 Service Team KPIs
Your service or support team is like the backbone of your organization. Those team members are the ones interfacing with clients on a regular basis. They are managing customer concerns and troubleshooting issues every day.
Part of your support team’s responsibilities includes making sure your customers are up and running without disruptions to their day-to-day activities. You need to ensure your team is as efficient as possible so that your clients are, too.
Equally as important is making sure that your clients feel like they’re taken care of. They need to feel like they are in trustworthy, reliable, and friendly hands, and your support team will, frankly, determine your reputation.
Knowing all this, it makes sense that our top KPIs focus on optimizing service desk efficiency and satisfaction.
Tickets per Endpoint (per client)
This metric creates a ratio between total number of tickets and endpoints, which helps normalize the data. So you may have a client with 100 tickets per month but 1000 endpoints and then another client with 50 tickets per month but 50 endpoints. By looking at the ticket number you might think the lower volume is better but when compared to the endpoints it becomes obvious it’s not.
SLA Missed
Complying with your Service Level Agreement (SLA) is critical. This is your contract and what will be looked at to determine whether you’re delivering on what you promised. If you are falling short on your SLAs, this is an indication that you may be over-promising your services or may need more resources to be working optimally.
Customer Satisfaction
Based on surveys, this gives insight into how satisfied your clients are with your service team’s performance. This is really important because you want to ensure your customers are pleased. This will help you determine who is pulling their weight and where there’s room for improvement.
Daily/Weekly Utilization Rate
Don’t overlook this one because this number can directly contribute to your bottom line. Monitor it to ensure your service team is operating as efficiently as possible and that each technician is being utilized optimally.
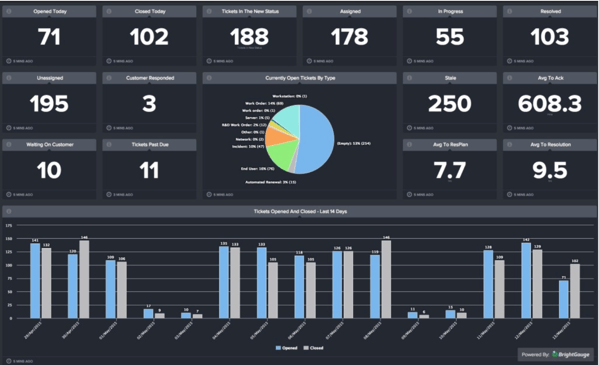
Issue Backlog/Currently Open Tickets
By monitoring the backlog or the number of open tickets at any given time, you’re able to easily see the workload of your entire team or individual team members. If the backlog gets too crazy, you can decide whether to add resources to your team or investigate what’s causing any issues.
Kill Rate
This looks at your Tickets Closed divided by your Tickets Open over the same time period, usually per day. You want to aim to get a number over 100% because this means that you’re closing more tickets than were opened today, so you’re staying ahead of the backlog.
Pro tip: Use thresholds to show your service team how they’re performing at a glance - on your BrightGauge dashboard, set a threshold that sounds an alarm anytime your kill rate falls below 100%. Your techs will know they need to step things up ASAP.
Tickets Resolved Today
Pretty self-explanatory, but this number tells you how many tickets each technician is resolving on any given day. Looking at this number versus Tickets Opened Today will tell you how productive and efficient your technicians are and, if there’s a lag, what the cause may be.
Billable Hours
It’s important to see how many hours each of your technicians is billing and what they are spending their time on. This can help you determine if you’re using your resources wisely or if there are changes that need to be made to avoid being wasteful.
Use BrightGauge Goals to inspire healthy competition
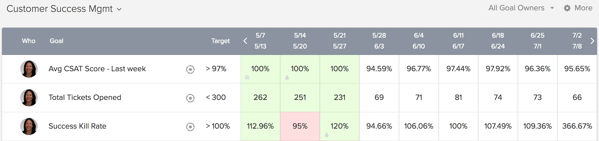
We love the idea of motivating service teams through the use of the BrightGauge Goals feature. This feature allows every member of your team to set quarterly goals based on overall company KPIs. Everyone will have visibility to these goals, so it’s a great motivator and a way to establish a culture of accountability.
And we love making a challenge out of goals. Encourage your team to “compete” against each other to see who can be most consistent when it comes to reaching a goal.
For example, say you want to have no more than 10 Open Tickets at the end of each week. Each team member can mark their status at the end of the week and the leader can be determined or rewarded. Or, create a challenge where each technician has a Customer Satisfaction rating of 97% or more for at least 10 out of 12 weeks. No one likes to miss a goal (even though it’s okay to do so), so your techs are going to work really hard to make sure they’re doing right by these challenges!
While goals should not be tied to performance reviews, they do provide insights as to any gaps that need to be filled or resources that need to be shifted around.
For more on service KPIs (including formulas!), plus insight into how ConnectWise Manage and BrightGauge can help you make better, more informed decisions, read our whitepaper: The Service Desk KPIs Top MSPs Rely on for Success & How to Use Them in Your Business.

Free MSA Template
Whether you’re planning your first managed services agreement, or you’re ready to overhaul your existing version, we've got you covered!

