4 Types of Data Dashboards You Need to Create

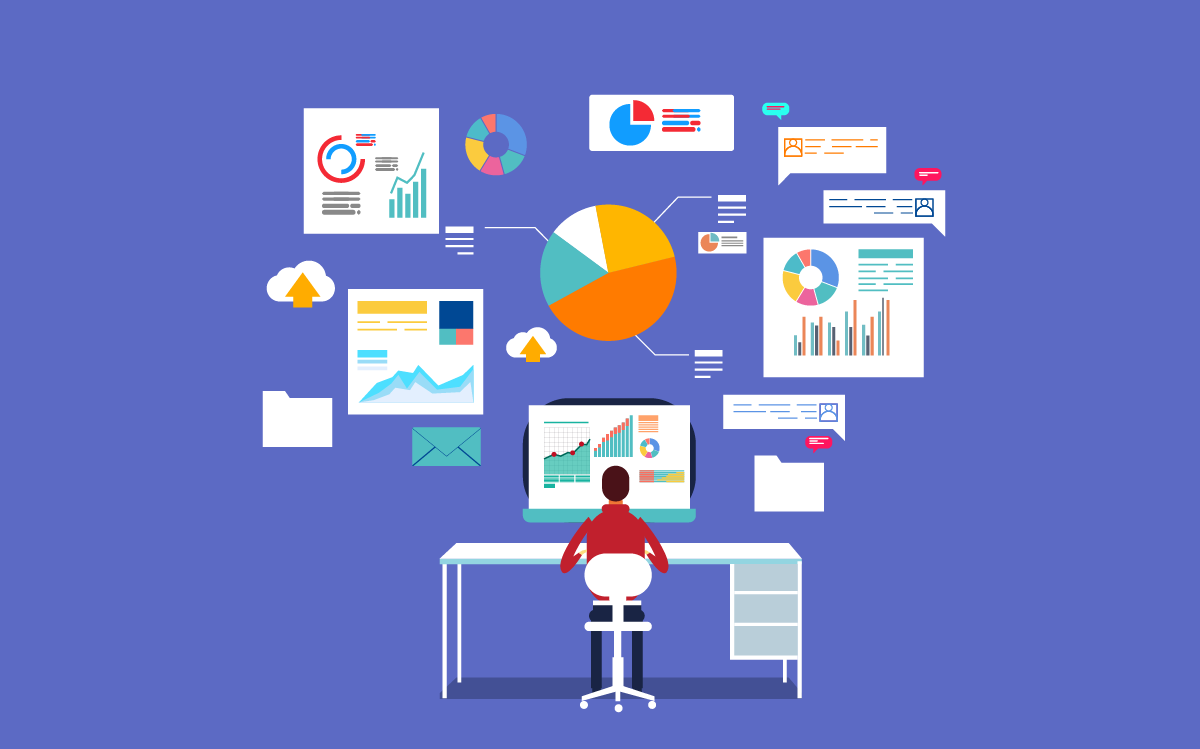
Tracking key performance indicators (KPIs) is crucial for a business to measure and enhance success. Data dashboards help to make tracking important performance metrics easier for leaders who want to improve their company’s competitiveness.
What is a data dashboard? Which types of data dashboards should you use in your organization? Here’s a quick explanation, followed by some data dashboard examples you can use for your business:
What is a data dashboard?
A data dashboard is a collection of important KPI information that is assembled into one convenient display. The specific performance metrics will vary between different types of data dashboards and the goals of the organization—a data dashboard for a sales team will be very different than the one used by a service delivery team, after all.
Data dashboards can double as a motivational tool for some organizations, especially when those dashboards are put up in a display that everyone can see. Dashboards can also be incredibly useful for managers in their one on one meetings with team members—providing easy access to important performance data for assessing employees.
What types of data dashboards should I use?
There are many different types of data dashboards that you could create for your organization. Naturally, not all data dashboards are going to be useful for all organizations. Your company may need a specific type of data dashboard to track information for a particular goal or initiative.
So, when looking at the following list of data dashboard examples, keep in mind your own business’ goals and needs, then use that information to determine whether each of these dashboards can benefit you:
Data dashboard example #1: Employee dashboards
This is one of the most common types of data dashboards used by every business—employee performance dashboards. However, while virtually any business can use employee dashboards, the specific KPIs that they track may vary from one company to the next. Even employee dashboards within the same company might differ depending on the employee’s specific role in the company.
Two examples of KPIs that you might track on an employee dashboard include:
- Ticket Close Rate. For a service team member or call center employee, you might track how many service tickets that employee closes in a given week to benchmark their performance compared to their peers.
- Billable Project Hours. For project team members, measuring how much time each team member spends on a project helps with accurately billing projects and estimating employee efficiency.
Data dashboard example #2: Sales team dashboards
The sales team plays a key role in your business’ success by closing sales deals and building relationships with customers/clients. Tracking sales team performance metrics helps you identify strengths and weaknesses so you can improve their skills as a team.
However, instead of tracking an individual employee’s performance, sales team data dashboards provide a broader scope of information, focusing on the team as a whole with metrics such as:
- Overall Sales Funnel. This performance metric helps to visualize the count of opportunities created as well as closed/won deals. Looking at the last 30 days, you can see how your sales team is performing and compare it to their yearly averages and goals.
- Total Pipeline Dollars. How much money is sitting in your pipeline, waiting to close? Tracking your total pipeline dollars, as well as how far along each deal in your pipeline is, can help you predict how much revenue your business can expect in the next month. Tracking the rate at which you close deals on top of this metric can help to further refine your income estimates.
Data dashboard example #3: Client services dashboards
For B2B (business to business) service-oriented companies, being able to meet contractual service level agreements (SLAs) with clients can mean the difference between sustained success and losing market share. Tracking KPIs related to these SLAs is a must for B2B companies.
While the specific KPIs you will track on your client services dashboard will vary depending on the nature of the services you provide, a couple of potential performance metrics you might use include:
- New Tickets. A measure of the number of unresolved tickets that have not been responded to yet. Can be combined with tickets currently open to showcase how much work is being generated, which helps to put response time and other metrics into perspective.
- Tickets Waiting on Customer. A measure of how many open tickets are waiting on input from the customer before they can be worked on. Putting this into a report for your clients helps encourage them to respond to inquiries more quickly, which allows your team to provide faster service.
Data dashboard example #4: Financial performance dashboards
Rather than measuring the performance of any one team or team member, financial performance data dashboards help you get a picture of your company’s financial health at a glance. This can be crucial for spotting issues that threaten the future viability of your company.
A couple of financial performance metrics you might track for your company include:
- Past Due Receivables Amount. Accounts receivable is critical because it helps you set an expectation for your income from clients within a set period of time. Past due accounts receivable highlights which clients you need to increase your outreach with.
- Earnings Before Interest, Taxes, Depreciation, and Amortization. Abbreviated EBITDA, this metric helps establish your overall profitability and is often used to calculate things such as employee bonuses.
Do you need help creating comprehensive and effective data dashboards to help your business achieve maximum performance? Reach out to the team at BrightGauge to learn more!
Free MSA Template
Whether you’re planning your first managed services agreement, or you’re ready to overhaul your existing version, we've got you covered!


