

There’s a reason why automation is such a highly regarded business practice. It can save MSPs a ton of time and allow you to get back to revenue-generating tasks that will move your business forward.
When you automate something like the generation and delivery of consistent KPI (key performance indicator) reports, it’s a win-win: you save time on a really important, but often tedious task and you build trust and transparency with your clients, which ultimately leads to repeat business.
With BrightGauge, all integrations come with default report templates that are ready to customize and send out, or you can create your own templates and schedule them to send out on a recurring cadence based on your preferences.
The set-up time is minimal and the pay-off can be really rewarding. We’ve had partners report that BrightGauge saves them 8-10 hours per week in comparison to using spreadsheets to generate KPI reports, which is really time-consuming and clunky at best.
Just ahead, 5 BrightGauge reports that you can start using this week to save you hours and strengthen your transparency practices.
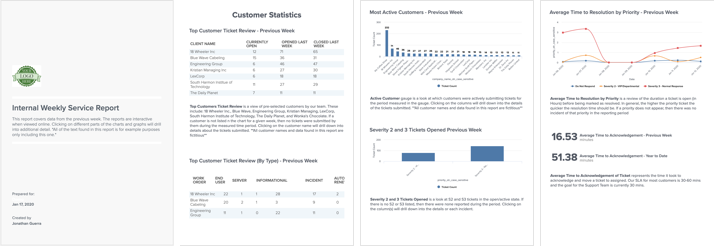
Internal Weekly Service Report
You may already be accustomed to holding a weekly service desk “stand-up” with your team, where you review the prior week’s numbers and see where adjustments are needed to get the team on an optimal track.
It’s important to make sure your team or even individual techs are hitting goals for average response time, kill rate, SLAs, and so on, which are the KPIs that should be evaluated during the stand-up.
An internal report highlighting these KPIs can reinforce what was discussed and serve as a visual reminder for what’s working and what isn’t. As a bonus, being able to refer to those reports over time can indicate trends and patterns that would be worth knowing about.
Here’s an example of an Internal Weekly Service Report in BrightGauge that you can recreate yourself using this buildout key:
Executive Summary Report (or End of Month report)
This is a good report to share with key stakeholders and decision makers to show the value of what you’re doing and how you are helping clients remain successful. You should cover the KPIs that are most important to your client and give them a report that will take no more than a few minutes to look over, while still making a big impact.
It’s up to you and your client to decide how often to send this type of report, but generally, at least once a month is a really good idea.
Here’s a look at one End of Month report example that focuses on tickets, devices, and networks:
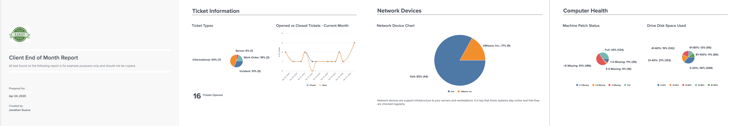
To recreate this report for yourself, see this buildout key.
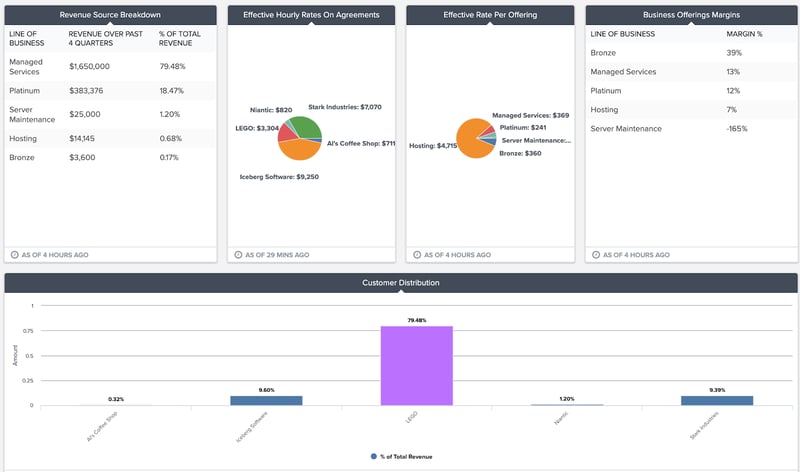
Finance KPIs
What business owner or manager is not interested in the health of their finances? Knowing crucial finance KPIs such as gross profit margin, monthly recurring revenue, cash on hand, and so on can help MSPs make informed business decisions that shape the future of their companies.
An automated Finance KPI report makes it easy and a no-brainer to stay on top of those metrics and act upon them before they become an issue.
You can present these Finance KPIs to your executive team in dashboard form, as shown below, or select “Convert to Report” from your dashboard menu to get it into a report format. See this buildout key to recreate these KPI gauges for yourself.
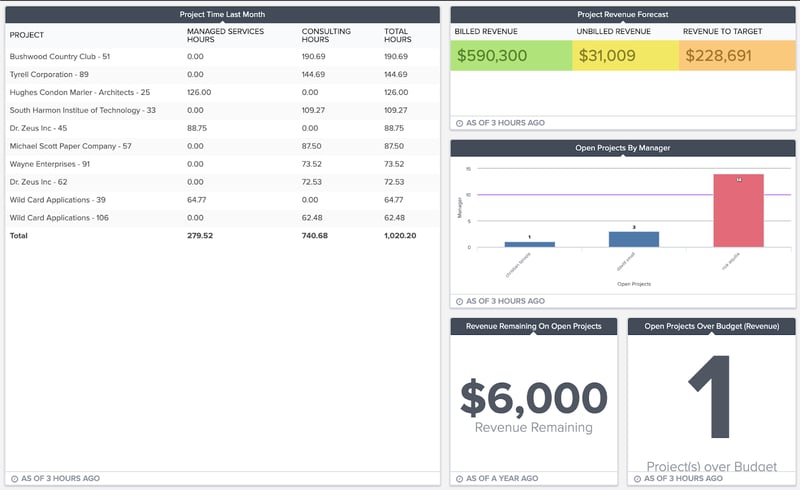
Project Updates
What’s the status of your active projects? How much time is spent completing those projects? What’s coming up in the next month or so?
When it comes to keeping your clients informed on what’s going on with various projects, it makes sense to send a projects KPI report that shows metrics and data pertaining to the projects relating to that client.
Your Project Management KPIs can be shared as a dashboard (read about sharing BrightGauge data here), or you can select “Convert to Report” from your dashboard menu to share it as a report. See this buildout key to recreate these KPI gauges for yourself.
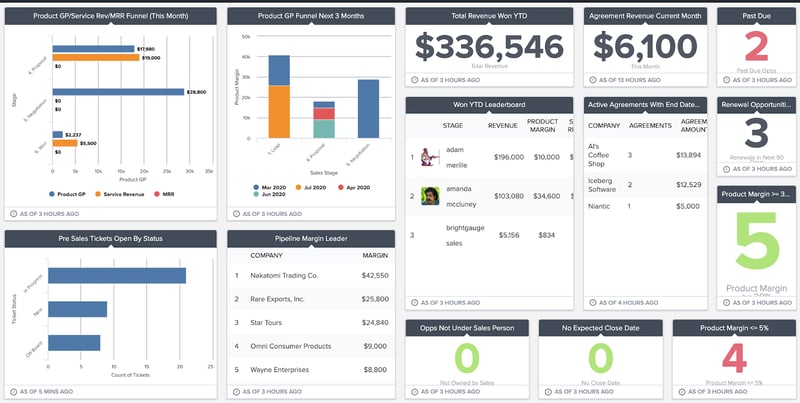
Sales KPIs
This will likely be more internal than client-facing, but will be of equal interest to sales managers and internal stakeholders. Sales activities are a good predictor of future revenue and business performance, so it’s important to keep an eye on KPIs such as opportunities in the pipeline, deals won, and monthly recurring revenue.
Again, feel free to share your Sales KPIs as a dashboard or convert it to a report if you prefer! Either way, here’s a buildout key to recreate these KPI gauges for yourself.
See more dashboard and report examples here.
To learn more about how BrightGauge dashboards and reports can save you hours each week and give you a better understanding of your data, contact us today and we’ll be happy to chat.

Free MSA Template
Whether you’re planning your first managed services agreement, or you’re ready to overhaul your existing version, we've got you covered!

