

As the world shifts to remote work, managers are having to learn new ways to keep their teams motivated and on task.
Without the ability to pop over to someone’s desk or have a passing conversation in the hallway, it seems to be a bit more challenging to know what your technicians are working on.
This is where dashboards can have a really profound impact. Business intelligence dashboards act as a single source of truth and paint an accurate picture of what’s going on at any given moment.
This month, we’re showing you two BrightGauge dashboards that are daily must-haves for working with your remote team.
Managing to Zero dashboard
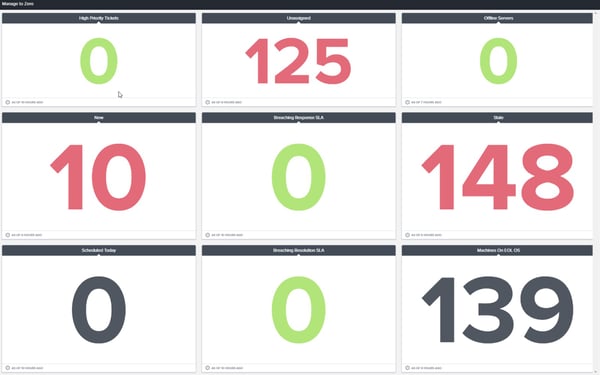
*View this sample Managing to Zero dashboard here
The point of this dashboard is to manage all metrics to zero within a specific time frame. So, the goal can be to have each metric on the dashboard hit 0 by the end of the day or week.
In BrightGauge, you can filter this dashboard for each specific technician and share with them, that way everyone is on the same page and knows what they need to work towards.
Here’s a breakdown of the key performance indicators (KPIs) displayed in the Managing to Zero dashboard:
- High Priority - A count of any currently open high priority tickets. Managing this number to zero ensures that all high priority items are handled in a timely fashion.
- Unassigned - A count of all currently open tickets that have no technician assigned. Keep an eye on this metric so that all of your customer’s issues and requests are not overlooked.
- Offline Servers - With your customers relying heavily on their technology during this time, making sure you maintain and manage the amount of servers that are going offline is more essential than ever.
- New - A count of all tickets that are still in a "New" status. Often this is an indicator that there has not been progress made on these tickets. Highlighting this item for your team should help keep them on track.
- Breaching Response SLA - This gauge will show any tickets that are within 60 minutes of breaching their response SLA. Managing this metric allows you to stay true to the expectations you have committed to with your customer base.
- Stale - A count of all tickets that have not been updated in at least 7 days. Make sure you keep this number to zero, so that none of your customer's requests fall through the cracks.
- Scheduled Today - A focus on tickets that are currently open and scheduled for today. Staying on top of these tickets should also aid in keeping your techs on task.
- Breaching Resolution SLA - This gauge will show any tickets that are within 60 minutes of breaching their resolution SLA. Managing this metric allows you to stay true to the expectations you have committed to with your customer base.
- Machines on EOL OS - Ensuring that your customers are on a reliable OS is extremely essential during the new work-from-home environment we are in. Reliable technology will allow them to operate efficiently and in turn increase your value as a partner.
Managing to Green dashboard
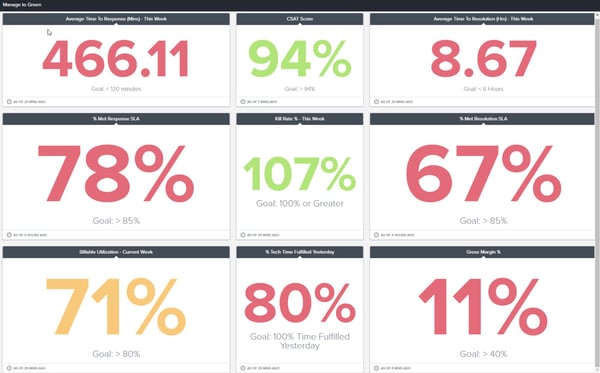
*View this sample Manage to Green dashboard here
Another essential, this dashboard gives a view of the current state of affairs. The goal is to have your KPIs consistently within a ‘green threshold’, which indicates that you are on the right track. Metrics that turn to red show areas where you may be falling behind, allowing you to respond quickly and course correct.
With BrightGauge, you have the ability to set thresholds based on numbers that you’ve deemed indicative of a problem. When that benchmark is crossed, your gauge will change colors, making it very easy to identify a problem and act on it immediately.
In this sample dashboard, we’ve chosen KPIs with arbitrary goals and thresholds set to them just to highlight the idea behind the Manage to Green dashboard. When creating this dashboard for your use, make sure to choose goals and thresholds that match your internal standards. Here are our examples:
- Average Time to Response (mins) - Keeping your response time low and within an acceptable threshold allows you to provide an exceptional service to your customer base. Make sure this metric fits within internal expectations.
- CSAT Score - A quick glance at your customer's sentiment towards you. Customer retention is key during these times.
- Average Time to Resolution (hrs) - Keeping your resolution time low and within an acceptable threshold allows you to provide an exceptional service to your customer base. Make sure this metric fits within internal expectations.
- % Met Response SLA - A percentage of tickets that have met their response SLA compared to all of the tickets that have been worked that week. Use this gauge to make sure your team is meeting the commitments you have made to your customers.
- Kill Rate % - This is a quick glance into your team's efficiency. Calculated by taking tickets closed divided by tickets opened, this metric should always stay at 100% or higher. 100% means you have closed as many tickets as have been opened this week. Anything below 100% indicates that there may be some lingering tickets.
- % Met Resolution SLA - A percentage of tickets that have met their response SLA compared to all of the tickets that have been worked that week. Use this gauge to make sure your team is meeting the commitments you have made to your customers.
- Billable Utilization % - This calculates the amount of billable time your team has submitted versus their total time submitted.
- % Tech Time Fulfilled Yesterday - A view of the time submitted yesterday versus their daily capacity set within your PSA. If this number ever falls below 100%, some of your technicians are not putting all of the time allotted in their daily capacity.
- % Gross Margin - A key metric in determining the overall profitability of your business offerings.
The Manage to Zero and Manage to Green dashboards are easy to implement and share and can make a big difference in your team’s productivity and efficiency each week. Having these two rules (‘no red’ and ‘get to 0’) is a quick solution to getting everyone on the same page.
To recreate these dashboards for your own teams, check out the links below:
Link to Manage to Zero Recreation Key
Link to Manage to Green dashboard
Link to Manage to Green Recreation Key
Please feel free to reach out to success@brightgauge.com with any questions you have!

Free MSA Template
Whether you’re planning your first managed services agreement, or you’re ready to overhaul your existing version, we've got you covered!

