
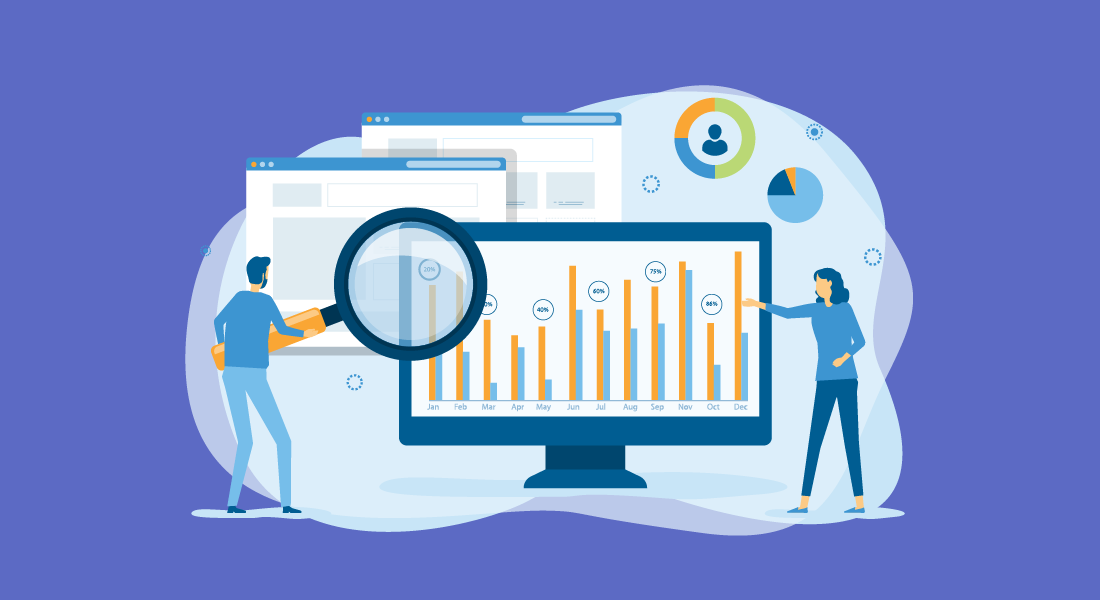
Anyone who’s familiar with managed IT services is aware of how busy service desk technicians can get. The to-do list can become so long, if not managed efficiently, and work can become tedious and overwhelming.
Things get even uglier (and miserable) when trying to manually integrate what everyone is working on into one single platform. Surely there has to be a better way to do this. Fortunately for you — and for all of your clients — technician dashboards provide an effective solution.
What Role Do Technicians Play in an MSP?
Technicians play a crucial role for managed service providers. They ensure continuity of IT services and provide remote support whenever a customer is having technical issues. Depending on their department within the MSP, they will need to be skilled at any of the following fields:
- Cybersecurity
- Infrastructure management
- Application management
- Networking/switching hardware
- Networking protocols
- Firewall configuration
- Configuring and repairing cloud-based networking
- Troubleshooting and repairing servers and workstations
- Providing clients with one-on-one guidance
- Service desk support
Why Does Technician Efficiency Matter?
Technician efficiency matters because customer service is the backbone of any business. If you fail to prioritize customer satisfaction, your sales funnel will eventually run dry. The stakes are even higher within the information technology industry, since MSPs are responsible for keeping technology running for all of their customers. Without reliable technologies, productivity would be practically non-existent. Communications, security, and compliance with regulations would come to a halt.
By the same token, productivity is highly linked with profitability for managed service providers. Therefore, it’s essential to track what’s getting done, when it’s getting done, and how long it takes to get it all completed. What you’re paying in technicians’ salaries has to be validated by employee satisfaction and customer retention. And the only way to find out if it’s all being conducted as efficiently as possible is to look at the numbers, in real time. This is where data dashboards prove to be an invaluable tool.
What Role Do Data Dashboards Play in an MSP?
Data dashboards source information from your business tools — PSA, RMM, CSAT, and financial, among others — to let you see all relevant data in one place. Not only is everything located in one centralized location, but you can also customize them to display the numbers you’re most interested in tracking.
Seeing everything right in front of you lets you identify patterns that can help you improve your services. And since every department is responsible for different areas of business, it’s good practice to set up dashboards by teams. Specifically addressing your technicians, technician dashboards will help provide the best customer service possible.
What Are Technician Dashboards?
Technician dashboards display the same metrics that a service manager would track, but are filtered to only include the data from a specific service desk technician.
The metrics on these dashboards could include:
- Open Tickets
- Unsolved Tickets
- Updated Tickets
- Solved Tickets
- Unsolved Tickets by Status
- Unsolved Tickets by Group
- Average Satisfaction Score
- Average Time to Resolution
- Open vs. Closed (Last 14 Days)
You can customize the template to display information that’s relevant to the metrics you’re seeking. You can also choose the chart types you prefer to read, so that you don’t have to waste time trying to figure out what everything means. Once you’ve set your preferences, you can then clone your template for each of the technicians you want to track.
The right dashboard integrates with tools you’re already using in your business, so that you can keep everything in one centralized location. It should also be simple enough so that you can start using it straight out of the box.

Benefits of Technician Dashboards
Technician dashboards bring a long list of benefits to your business. By seeing metrics such as number of tickets, the time each of them was entered, and the time it takes to resolve them, you start to notice trends. As a result, you reap the following advantages:
Optimize Customer Service
Dashboards allow you to monitor each technician’s workload — which is crucial to optimize your customer service experience. At the end of the day, you don’t want clients waiting for an eternity because your service desk team is overloaded.
Identify Training Issues
If you start noticing that several of your technicians are experiencing the same issues, this may be indicative that it’s time for additional/updated training. It could also be a sign that your team may need additional resources to better address each ticket.
Employee Satisfaction
If your employees are given adequate support and resources, they are more likely to enjoy their jobs. This element goes hand in hand with the overall success of your company, since a high turnover rate results in higher costs for your business. Plus, customers may have to wait longer for their issues to be resolved while your new hires get up to speed on their roles.
Streamline Operations
When you look at the metrics, you see exactly which tickets need to be addressed, as well as highlight areas where a technician could improve or focus. By identifying these issues, your team is enabled to work smarter by prioritizing the right things.
Host Shorter Meetings
Raise your hand if you enjoy sitting in meetings that go on forever. By tracking service desk metrics through technician dashboards, technicians and management will all be on the same page. Management will know exactly what needs to be addressed, making meetings run smoothly.
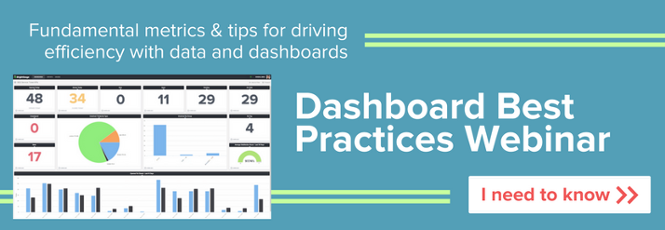
How To Set Up Technician Dashboards with BrightGauge

The BrightGauge data dashboards are user friendly for a reason — we understand wanting to work efficiently, then go home and do all the fun stuff you love. So you’ll be happy to know that setting up technician dashboards is a simple process.
- Log into your BrightGauge account and search for the service desk dashboard you’re using.
- Set up the filters you want to track by following our handy knowledge base instructions.
- Save the selected filters with the Save Filters feature.
- Clone as many dashboards as you need to track (this process is also included in the instructions).
- Invite the service desk technicians you’re tracking to log in and see their data. You can invite users by checking out our User Management Overview. (They can do so for free).
Manage Your MSP’s Technicians With BrightGauge’s Data Dashboards
With a variety of pre-built dashboard templates and a fully customizable system with filters for your departments, BrightGauge’s dashboard solutions can help you stay on track, adjust when needed, and meet your goals, short and long term. You can use existing dashboards or build your own, depending on your needs, and our team is ready to assist.

Free MSA Template
Whether you’re planning your first managed services agreement, or you’re ready to overhaul your existing version, we've got you covered!

