

Off the top of your head, do you know how much cash your organization has on hand? What was your gross profit last month? What’s your projected MRR this month?
If you don’t know these numbers right off the bat, how quickly can you get to them? Ideally, you can get this data immediately.
Keeping a watchful eye on your finance KPIs is a critical practice that informs pretty much all business decisions. If you’re not in the habit of doing this or aren’t sure of the best way to keep tabs on this data, don’t fret. It’s pretty simple to implement.
Why is it so important to track financial KPIs?
Aside from the obvious - knowing whether or not your business is profitable - tracking financial KPIs impacts day-to-day decisions that spill over into the long-term.
A (good) challenge that many MSPs are facing today is merging with or acquiring another company. Oftentimes when this happens, leadership teams are suddenly tasked with managing a growing organization.
How can MSPs efficiently grow and scale in this market? It’s all about letting data do the talking.
Tracking financial performance and patterns means that decisions are rooted in truth. Hard data can’t be manipulated and numbers don’t lie, so decision-makers can rest assured that they are taking the smartest actions.
Financial data can help when determining how many members to add to a team, where to set sales commissions, what tools or software to add to an existing stack, or especially when projecting goals for a coming quarter or year.
Owners and managers also use financial KPIs to figure out what area of the business to focus on. For instance, if revenue is dwindling because of a slow uptick in new clients, a heavy investment can be made in a sales and marketing team. Or, going back to M&A’s, if you’re expecting to take on a significant amount of new clients, it may make sense to focus investments on a more robust service team.
Whether deemed large or small, it’s pretty much a guarantee that all decisions are driven by financial data.
Another reason to always have an eye on finances: key stakeholders and investors care a whole lot about this type of information, so it’s best to have it on hand anytime a question is asked or a report is needed.
Keeping tabs on finances with the right tools
You’re most likely using a tool like QuickBooks to handle and manage your finances. It’s a very popular and reliable tool in the industry.
But, depending on the needs of your MSP, you’re probably using other tools like a PSA or RMM on a daily basis.
What ends up happening is that you spend the day toggling between windows to consume the data that’s important to you.
A smarter and faster way to be data-driven is to keep all your metrics in one central place, like a dashboard that gives you a bird’s eye view of your business.
That’s exactly what BrightGauge does. You can create specific dashboards for the areas of business you want to track and then have them on display throughout your office, giving you and other team members constant visibility into your KPIs.
In the case of finances, being able to glance at one dashboard to quickly understand the state of your business puts you in a prime position to be proactive, make decisions that lead to success, and manage incoming and outgoing cash in an optimal way.
Knowing where and how to get started
You’ve got the right tools in place and are adamant about making financial KPIs a priority, but how do you get started?
First, know that we offer a lot of resources to guide you. Our integrations come pre-loaded with default gauges, dashboards, and reports to get you off on the right foot.
With QuickBooks specifically, you’ll get gauges like Accounts Receivable Aging Summary, Amount on Invoices Sent This Week, Cash Balance, EBITDA Performance, Net Profit, and more. Pre-built QuickBooks dashboards include COGS, Expenses, and Revenues Details as well as a Financial Overview dashboard.
In addition to these templates, we have webinars, blog posts, and more that share what your peers are doing with BrightGauge.
But what it comes down to is deciding what’s most important to your business and your bottom line. What are your main goals that will define success for you? Start there, choose KPIs that align with your company goals, and put those metrics on one dashboard.
As an example, a BrightGauge customer recently gave us a look at a Leadership KPI dashboard that is shared with the executive team on a regular basis. It’s a high-level financial overview of performance in various departments, recurring revenue, and gross profit. See that dashboard below or click here:
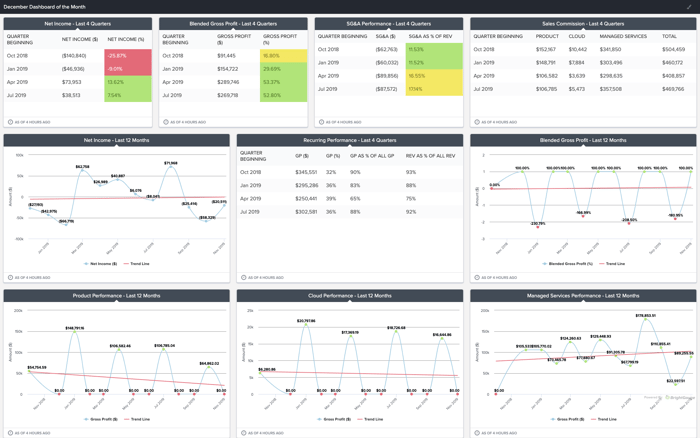
Because all these metrics are tracked every day, team members are able to communicate about this data at a moment’s notice, keeping everyone accountable and aligned to goals.
As a BrightGauge customer, you’ll never be left to figure things out on your own. Our support and success teams are always available to help you out.
Want to learn more or see BrightGauge in action? Contact us today and we’ll be happy to take you through a one-on-one demo.

Free MSA Template
Whether you’re planning your first managed services agreement, or you’re ready to overhaul your existing version, we've got you covered!

