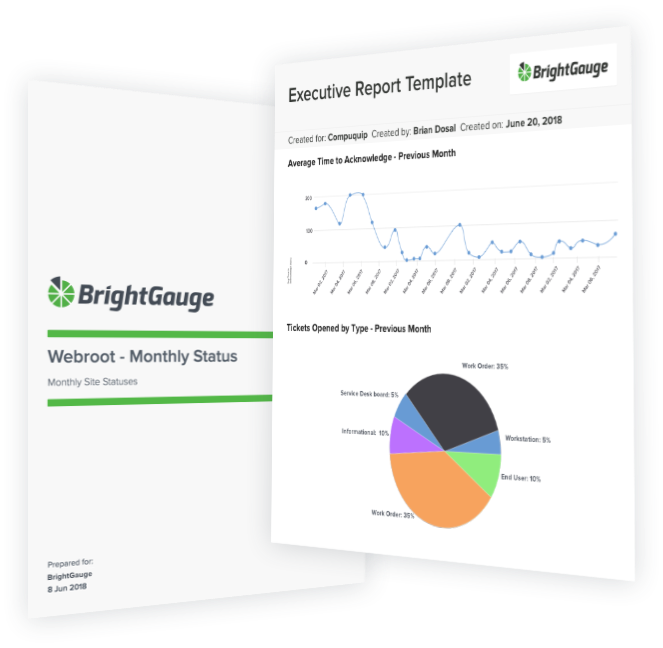
Reports don't have to be a struggle


With BrightGauge Client Reporting, create custom, powerful, interactive reports in just a few clicks, so you can focus more of your time on revenue-generating tasks.


Request a Demo Learn More 

Unlimited viewer licenses • No long term contracts

screen.png

Unlock your data

  • Time Today by Tech
  • Customers Updated
  • Tickets Open
  • Tickets Overdue

202 default metrics

  • Servers
  • Workstations
  • Mac Machines
  • Disk % By Server

54 default metrics

With the BrightGauge integration to ConnectWise MDR™, you can view the MDR Executive Report.
  • 1 Pre-Built Dashboard
  • 17 Default KPIs
  • 1 Pre-Built Report
  • Server Patch Status
  • Workstations AV Protection Status
  • Workstation Patch Status
  • Servers

50 default metrics

  • Count of Quotes by Status
  • Count of Quotes by Year
  • Gross Margin Amount by Quote Status
  • Quotes

12 default metrics

  • Agent Statistics
  • Device Statistics
  • Agents in Backup Error
  • Devices Out of Communication

16 default metrics

  • Revenue by Month
  • Net Profit Performance by Month
  • Accounts Receivable Aging Summary
  • Cash Balance

35 default metrics

  • Revenue by Month
  • Net Profit Performance by Month
  • Accounts Receivable Aging Summary
  • Cash Balance

35 default metrics

  • Open Tickets
  • Opened Today
  • Resolved Today
  • Tickets Opened by Issue Type

130 default metrics

  • Backup Quotas
  • Backup Space Per Repository
  • Jobs by Status
  • Repository Errors

11 Default Metrics

  • Configuration By Warranty Status
  • User Reputation
  • Configurations Expiring Next 30 Days
  • Configurations Expired

42 default metrics

  • Total Environments
  • Total Users
  • Total Metrics by System
  • Office 365: Active User Count
  • Office 365: Metrics Overview

56 default metrics

  • Revenue by Account - Last Month
  • Balance of Outstanding Invoices
  • Bank Current Balance
  • Invoice Revenue This Week

42 default metrics

  • Computers - Operating Systems in Use
  • Count of Devices by Model
  • Licensed Softwares
  • MacBook Pro

30 default metrics

  • CSAT by Company
  • CSAT by Customer
  • CSAT by Team member
  • CSAT Score
  • Feedback Steam - Full
  • Feedback Steam - Short
  • Helpdesk CSAT - 90 days
  • NPS Score
  • Positive Ratings
  • Negative Ratings

19 default metrics

  • Machines
  • Machines by OSX Version
  • Machines With Expired Warranty
  • Machines with 90% Disk Used

38 default metrics

  • Servers by OS
  • Out of Contact Machines
  • Workstations
  • Machines on XP

29 default metrics

  • Tickets Currently Open
  • Tickets Opened Last Month
  • Open vs. Closed Tickets - Trailing 30 Days
  • Opened Today

127 default metrics

  • Max round trip time by group
  • Devices by group
  • Devices Over 80% Memory
  • Devices Not Updated in 14 Days

19 default metrics

  • Open projects
  • Open tickets
  • Unassigned tasks
  • Past due tickets

87 default metrics

  • Net CSAT Score
  • CSAT Per Resource
  • Total Reactions
  • Days Since Last Negative Reaction

33 default metrics

  • Opened vs. Closed Tickets
  • Service Summary
  • Most Active Users
  • Tickets Opened by Type

145 default metrics

With BrightGauge + ITBoost, you will gain deep documentation insights including data around Knowledge Base Article health and upcoming domain, SSL, and other expirations.
  • Closed Opps by Type
  • New Business Won
  • Opps Won
  • Converted Leads YTD

63 default metrics

  • Calls Today by Technician
  • Machines with Active Contracts
  • Active Dispatches
  • Call Efficiency - MTD

72 default metrics

  • Daily Overview
  • Devices in Failed Status
  • Devices in Warning Status
  • Total Number of Backup Jobs

15 default metrics

  • Active Threats - Last Week
  • Attention Required
  • Infection Status - Last Week
  • Realtime Shield Status

21 default metrics

  • Contacts Created This Week
  • Contacts Created Last Week
  • Active & Completed Contacts by Campaign
  • Emails Sent This Week

51 default metrics

  • Average Satisfaction Score - Last 30 Days
  • Open - Client
  • Unsolved by Status
  • Solved Today

54 default metrics

  • Stale Systems
  • Servers Offline
  • Server Patch Status
  • Workstation Patch Status

27 default metrics

  • Average Temperature
  • Satisfaction Ratings by Temperature
  • Responses This Week
  • Comments This Week

37 default metrics

  • Server Patch Status
  • Servers
  • Workstation Patch Status
  • Workstations

31 default metrics

  • Managed Servers
  • Server AV Status
  • Server Disk Space Usage
  • Workstation AV Status

40 default metrics

  • Hours Worked by Day - Last 30 Days
  • Open Tasks by Priority
  • Tasks Met SLA - Current Month
  • Tasks Opened v. Closed - Last 30 Days

17 Default Metrics

  • Open To-dos Overview
  • Overdue Basecamp To-dos
  • Projects Overview
  • To-dos Completed in the past week

15 default metrics

  • Average CSAT Per Employee - Current Month
  • Client Response Summary
  • Response Score Summary
  • Unsatisfactory Scores (Less Than 5) - Current Month

22 default metrics

Upload your CSV data to OneDrive and integrate with BrightGauge to view on dashboards and reports

  • Call Logs by Member - Current Week
  • Call Logs by Result - Current Week
  • Currently Available Agents - Details
  • Total Calls per Extension Per Day - Current Week 

12 default metrics 

  • Total Sensors
  • Sensor Uptime (In Seconds)
  • Sensor Downtime (In Seconds)
  • Stored Reports
  • Stale Tickets
  • Sensor Status
  • Reports
  • Device Status
  • Active/Inactive Sensors
  • Inactive Sensors
  • Resolved Tickets

12 default metrics

  • Open projects
  • Stale projects
  • Hours vs Budget
  • Project Hours

29 default metrics

  • % Vendor Credit Limit
  • Month-to-date billings revenue
  • AR Aging by bucket past due
  • Bookings by Sales Person MTD

53 default metrics

  • Average survey rating
  • Average rating percentage
  • CSAT percentage
  • Surveys today

46 default metrics

  • Device Details
  • Entity Audits by Week
  • Offline Servers
  • Scan Status by Network Type

20 default metrics 

Upload your .CSV to Dropbox and BrightGauge will visualize that data

  • Unlimited Viewer Licenses
  • Unlimited Dashboards
  • Unlimited Reports

7 Default Gauges

  • Server Disk Space Used
  • Server Inventory
  • Servers Offline
  • Workstation Warranty Expiration Year

11 Default Metrics

Do you want to connect to a mySQL database?  Great!  BrightGauge has that ability.

Do you need to connect to a SQL Server?  Great!  BrightGauge can connect.

Do you want to connect to a PostgreSQL database?  Great!  BrightGauge has that ability.

Visualize and report on ConnectWise RPA™ workflow and bot execution more easily with this new integration for hyperautomation solutions.

  • 1 pre-built dashboard
  • 8 default gauges
  • 3 default datasets
An integration of x360Recover and BrightGauge, a ConnectWise solution, is now available in the ConnectWise Asio platform. Use this integration to monitor all your essential x360Recover key performance indicators (KPIs) directly in BrightGauge. Stay on top of backup statuses, available storage, client and protected system health,and many other key metrics. This integration empowers managed service providers(MSPs) to proactively manage their clients' backup and security, ensuring data safety and minimizing downtime risks.
  • 1 pre-built dashboard
  • 15 default gauges
  • 1 pre-built report
  • 5 default datasets
With BrightGauge and SentinelOne integration, you can incorporate and apply diverse data sources against the metrics of your clients’ endpoint defense postures to deepen your security analytics and enrich overall cyberinsights.

Use NinjaRMM + BrightGauge to manage your client's endpoints and networks. 

26 default metrics

Use Sophos + BrightGauge to strengthen your cybersecurity measures and stay on top of threats

26 default metrics

View All Integrations

Latest Feature

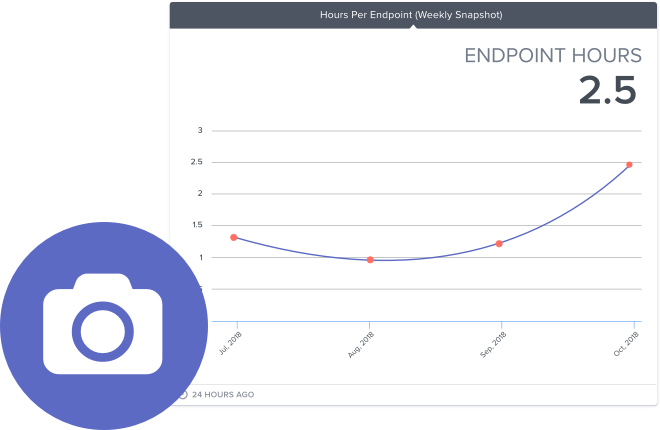
Introducing Data Warehousing Lite

Take daily, weekly, or monthly snapshots of the PSA and RMM data you want to track, so you can start identifying trends that impact your business. 

Learn more

snapshot-img
Always know what to focus on next

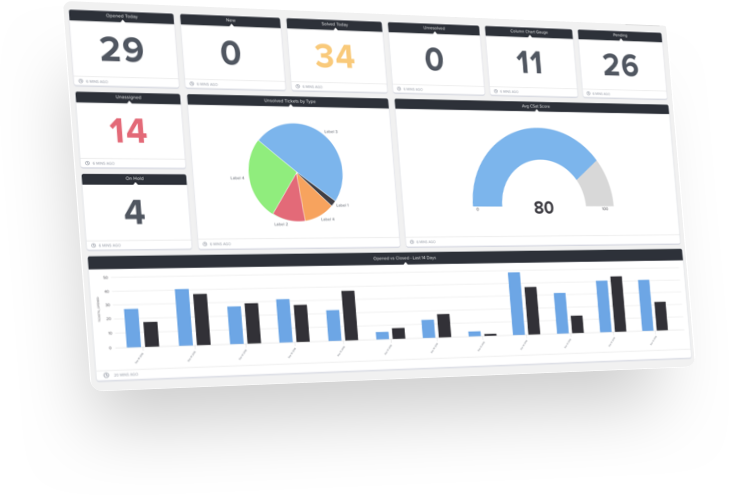
Get a real-time view with Dashboards

Monitoring your business shouldn’t take a heap of tools. With BrightGauge you can easily leverage your data insights and determine what needs your attention – all in one, easy to use platform.

Explore Dashboards

HeroDash.png

HIT YOUR TARGETS

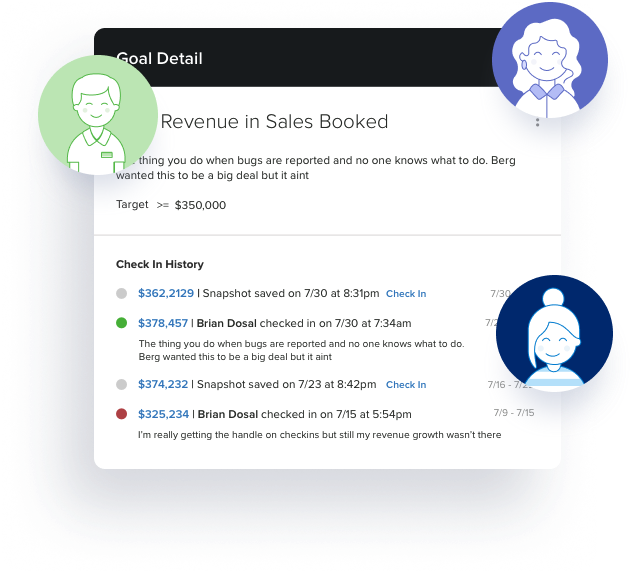
Accelerate Growth With Team Goals

With BrightGauge Goals, it's easy to hold your team accountable and keep them motivated. Team members set goals aligned with overall company KPIs and track them every week, so everyone is working towards success.

Explore Goals 

Hero Image Goals-1

Show me BrightGauge in Action

// Siteimprove tracking