
How many software programs do you use a day? From Gmail and Microsoft suites to media players, we’re all pretty much hooked on them. Most of what we do requires some type of program. It’s just a part of life. The status quo. C’est la vie.
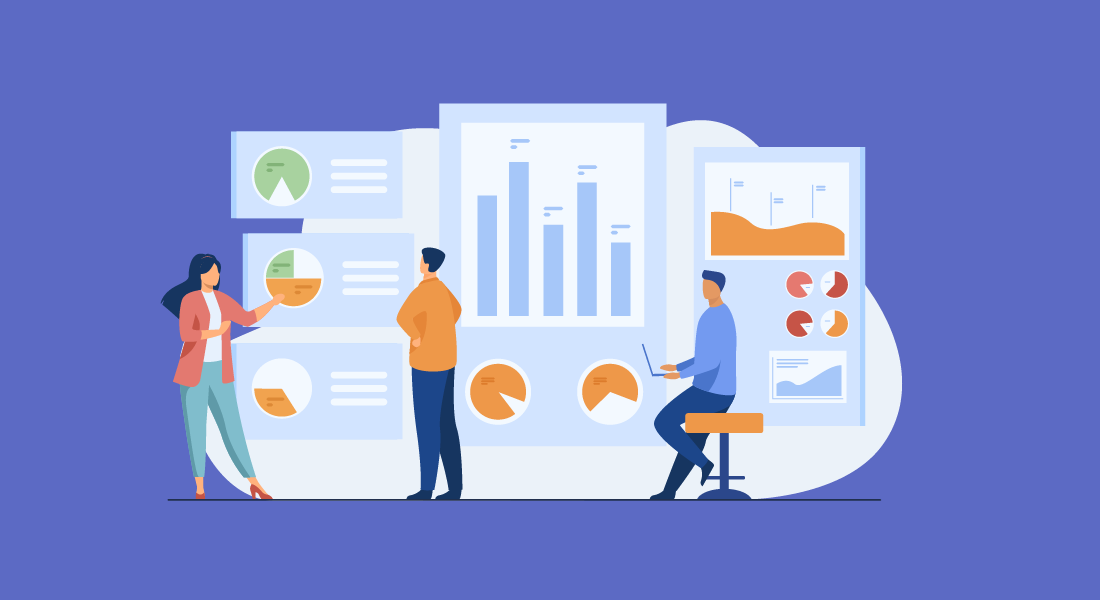
So naturally, it makes sense that we also use software for everything at work. And something that goes hand-in-hand with all these technologies is analytics dashboards. They are the starting point of any business’ roadmap for profitability and growth.
When it comes to dashboard software, you know that in theory, they are supposed to lead to sound decision making. But which factors should you consider to make sure you’re purchasing the right one?
Quick Links
- What Are Dashboard Platforms?
- Why Are Dashboards Important for Your Business?
- Benefits of Dashboard Software
- 7 Things to Consider When Choosing a Dashboard Software for Your Business
- Choosing the Right Dashboard Tools
What Are Dashboard Platforms?
Dashboards provide snapshots of business intelligence — such as key performance indicators and metrics — all in one centralized location. They are often updated in real time and can be customized to take into account several factors:
- The subject matter you’re tracking
- All related information
- Displayed by relevance
- Your preferred method of reading data (line graphs, pie charts, etc…)
Why Are Dashboards Important for Your Business?
Dashboards are important because they allow users to examine the performance of their business at a glance — all on one single screen. They’re also displayed in easy-to-understand ways. Being able to do so can help you:
- Identify whether you’re on track to hit your targets
- Identify any anomalies in your processes
- Identify risks
- Monitor day-to-day activities
- Ensure everyone’s on the same page
Benefits of Dashboard Software
Once you make it a standard business practice to study dashboards, you’ll soon discover many advantages:
Easy to Read
Effective dashboards are visually appealing and easy to read, regardless of whether you have any experience as a data analyst. This way, you can get to work as soon as you identify any issues instead of spending an eternity trying to figure out what it all means.
Transparency
Dashboards let you see exactly what’s going on in a particular area of business. Numbers don’t lie, and seeing them right in front of you lets you and your team know whether there are any issues and work on ways to resolve them.
Identify Trends
By looking at analytics on older dashboards, you can notice historical trends, which you can then compare with the current ones. You can also notice customer hurdles, such as when website visitors tend to leave when they reach a specific page, or a decrease in sales during a specific time of the year. This is crucial to improve on such deficiencies.
Business Monitoring
You can build a dashboard to monitor process efficiencies, team productivity, inventory, sales, or anything else that’s relevant to your business. Need to hit daily targets? Ensure that a certain number of tasks are completed? Check on your team’s workload capacity? All of this becomes easily identifiable with the right dashboard.
Optimize Performance
Once you’ve identified what’s not working, you’ll know exactly how to move forward to fix it. Even if you have to do A/B testing on your marketing campaigns, hire more people, or ramp up your cybersecurity, these trial-and-error actions are still pushing you towards finding something that works.
7 Things to Consider When Choosing a Dashboard Software for Your Business
Ok. So dashboard software is extremely useful. But they’re not all created equal. When deciding on which one to purchase, consider the following factors:
1. Integrations
Nothing in any business works in silos, so the ability to integrate with other tools you currently use is essential in finding the right one. BrightGauge dashboards integrate with 40+ tools that you're already using. We are also part of the ConnectWise family, and BrightGauge integrates with some of its most popular tools used by managed service providers (MSPs), such as Manage, Automate, and Sell.
2. Understands Human Cognition
There’s only so much data the brain can process at once — and it does so most effectively with images. While this is why dashboards are the most effective way of communicating data, you still want to ensure you have visuals with a simple structure. At the end of the day, most people have the capacity to remember 5-9 things at the same time.
3. Customization
Not everyone reads data the same way. You want software that allows you to choose how to view information. For example, clients may prefer various visualization formats, like graphs, charts, and boards. You also want features that allow you to adjust sizes, fonts, colors, and styles, and provide the option to deliver content in a way that matches a user’s job role. This way, each person can only access the data that is most relevant to their responsibilities.
4. Collaboration
Some dashboards limit the number of users who can access it — or the number of people who can work on it simultaneously. Depending on your specific needs, you’ll want to verify whether a software enables multiple departments to work together, or if you’ll have the ability to share the data with external users
5. User Experience
User experience (UX) is crucial with any type of software. Your dashboards should be easy to navigate and offer clear data visualization. Another important feature to look for is the ability to choose to show only the most relevant data points specific to different end users. And finally, you want a dashboard that explains what data means — whether by labeling or verbal descriptions.
6. Automated Refreshing
If you’re creating operational dashboards or displaying any other information that’s time-sensitive, you want to see information displayed in real time or in near real time. This is where automated or scheduled refreshing can help streamline your reporting – no more manual updates and long waiting periods to collect your data. Simply set a schedule to refresh your dashboard at specific intervals. For example, if you have a weekly sales meeting every Friday afternoon, schedule automated refreshing for Friday mornings.
7. Automated Reports
Sometimes, you have to wait a long time before you’re able to compile all of your data and start looking for trends. This is tedious and extremely time-consuming. Therefore, you want to look for software that automatically gauges daily, weekly, or monthly pictures of your metrics; then lay them side by side. This allows you to identify noteworthy patterns much sooner.
Choosing the Right Dashboard Tools
Creating effective dashboards doesn’t have to be as time consuming as it sounds. With the right tools, like BrightGauge, you get powerful reports out to your clients whenever you want.
Some of our partners have reported that our tools have saved them 8-10 hours per week, which is time they can now spend focusing on revenue-generating tasks — or on doing some fun stuff with their loved ones after a long day at work.
For an in-depth look at the BrightGauge dashboard technologies and other features, please contact us so we can set you up with a live demo.

Free MSA Template
Whether you’re planning your first managed services agreement, or you’re ready to overhaul your existing version, we've got you covered!

