
Modern life runs on data. Even if you don’t track anything in your personal life, search engines and social media do it for you.
You understand it’s by design, to show you content you would be interested in, or to try to persuade you that yes, you indeed need yet another pair of running shoes. And when it comes to your professional life, you’re aware that collecting business intelligence is the only sound way of tracking progress and making decisions.
The reasons can be endless — getting an overview of website visitors, conversion rates, or customer support tickets, to name a few. But what’s the most efficient way of doing so? With so many options available, it can be overwhelming to look into what would be the ideal solution for your needs.
Enter data warehousing and snapshots. Up until this point, you may not have been aware of how much you need them. But need them, you do.
Quick Links
- What is Data Warehousing?
- How a Data Warehouse Works
- 5 Benefits of BrightGauge Snapshots, a Data Warehousing Solution
- How To Set Up Snapshot Gauges
- BrightGauge Provides Effective Data Warehousing With Snapshots
What is Data Warehousing?
Data warehousing refers to the electronic storage of business information. It facilitates data management by allowing users to organize, categorize, and analyze large amounts of data.
They are different from traditional databases because data warehouses are specifically designed to perform analytics from large quantities of information.
Data warehouses can extract information from a wide array of sources, including:
- Relational databases
- Data software
- Business applications
- Processing systems
- Marketing and sales departments
- Finance
- And many more
They are beneficial because they collect information consistently, make it easily accessible, allow collaboration, and enable data-driven decision making. And just like servers, infrastructure is available to keep on-site or cloud-based.
Another benefit is that you can compare up-to-date data with historical information so that you can have reference points, track progress, and identify trends.
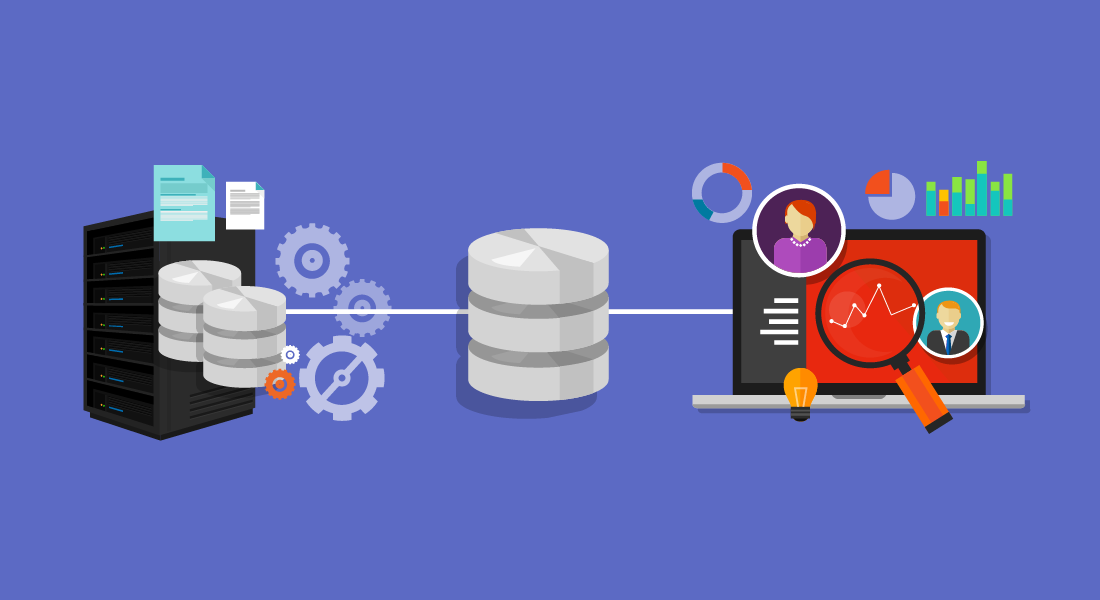
How a Data Warehouse Works
Data warehouses source information at regular intervals — or cadence. You can then create dashboards so that you can identify insights from the collected information. This process involves three layers of data:
- The first layer contains the extracted information.
- The second layer transforms/formats the information.
- The third layer organizes it and displays it on dashboards.
This process is known as ETL (for extract, transform, and load); and it’s an invaluable tool to analyze business intelligence, since not only does it integrate information from multiple sources, it also provides an in-depth historical context.
5 Benefits of BrightGauge Snapshots, a Data Warehousing Solution
At BrightGauge, we offer data warehousing, as well as an upgraded version for our customers on our enterprise plan, Enterprise Data Warehouse (EDW). This upgraded version includes a Snapshots feature, which captures even more in-depth, complex data and performs calculations.
There are several clear advantages to using our Snapshots solution:
1. Use Automatic Compilation of Metrics
Data can come from so many different sources, in so many different formats. And while there are many tools that help businesses compile data, our Snapshots feature does so automatically and displays it all in one custom-made chart.
2. Track End-of-Day Tickets
Customer service is the backbone of any business — and it’s something every company should consistently work on improving. Since Snapshots collect data automatically, you’ll be able to easily identify whether your support services are efficient or whether you have an expanding backlog of tickets.
3. Keep Track of Pipeline Health
By the same token, Snapshots can provide you a detailed view of your sales pipeline, as well as whether you’re on track to meeting your sales goals.
And it’s not just a matter of how many sales qualified leads are present at any given moment. You also want to be able to track performance at each stage of the buyer’s journey, as well as the costs associated with getting people to the bottom of that funnel.
4. See Your Sales Cycle Timeline
How long does it take you to close a sale? How much time do you have to spend nurturing leads before they become so enamored with your services, they choose you over your competitors?
It can take months for B2B marketing to work its magic — maybe a slightly shorter timeframe for SaaS businesses. But you want to keep track of the entire process to see whether you can identify any areas for improvement.
5. Remote Monitoring and Management Tracking
If you're managing your company's network through an RMM tool — such as ConnectWise Automate — Snapshots can gather information regarding space usage, server patch status, operating systems, or anything regarding your infrastructure, so that you can identify trending endpoints.
How To Set Up Snapshot Gauges
The Snapshots feature is only available on the Enterprise Plan; and you can turn any gauge in your account into a snapshot.
- Find a metric that you want to track.
- Select the timeframe you want to take the snapshots — daily, weekly, or monthly. You can do this by clicking on Design on the top left navigation bar, then scrolling down to the Schedule green button on the left side of the screen. If you choose weekly or monthly, you can choose on the dropdown menus which day of the week or month you want to take the snapshots.
- Select the number of data points you want to include on the graph from the drop down menu that’s located under the scheduled dates and times.
- Remove the dimensions on the gauges by clicking on Dimensions on the navigation bar at the top of the screen.
- Select the gauge you’re tracking from the icons at the top of the page.
- Select the camera icon at the top of the page.
- The most recent data will always appear on the top right corner of the snapshot.
- As you continue selecting the camera icon for the different gauges you want to track, you’ll see each section appearing in the middle of the snapshot’s graph.
If you need visual instructions for how to do this step-by-step, you can watch the video tutorial on our website.
BrightGauge Provides Effective Data Warehousing with Snapshots
If you are toggling between many tools, pulling data from each of them, inputting it into an Excel spreadsheet, and then spending hours analyzing it to draw conclusions, you could be eating into many valuable hours of your time.
BrightGauge gives you back that time. Some of our partners have said that our tools have saved them eight to 10 hours per week, which is time they can now spend focusing on revenue-generating tasks.
For an in-depth look at the BrightGauge Snapshots and other features, please contact us so we can set you up with a live demo.

Free MSA Template
Whether you’re planning your first managed services agreement, or you’re ready to overhaul your existing version, we've got you covered!

